
The Target Group Problem Nobody Talks About
Most campaigns underperform not because the creative is weak or the offer is wrong.
They underperform because their TG (target group or target audience) definition is wrong.
Demographic segmentation, the kind that says “women, 25 to 44, household income above $75,000,” tells you who someone is on paper. It tells you nothing about what they are doing right now.
Two people can be identical on every demographic dimension and sit at completely different points in the purchase cycle. Sending them the same campaign is not targeting. It is broadcasting with a filter in front of it.
The brands closing the performance gap have moved from describing their audience to predicting what each segment will do next and building campaign logic around those predictions.
In episode 12, we covered the personalization layer: how to move from identity signals to behavioral signals and deliver relevance within the right window. Segmentation is the upstream decision that determines which signals reach which audience, and what happens when they do.
This episode covers:
- The shift from demographic to behavioral and predictive segmentation
- How the RFM model works and where it breaks
- Building segments that forecast behavior, not just categorize it
- Dynamic membership and why static segments fail
- Testing and refining segments against campaign outcome data
Beyond Demographic Segmentation
Three questions. Three segmentation types. Completely different infrastructure.
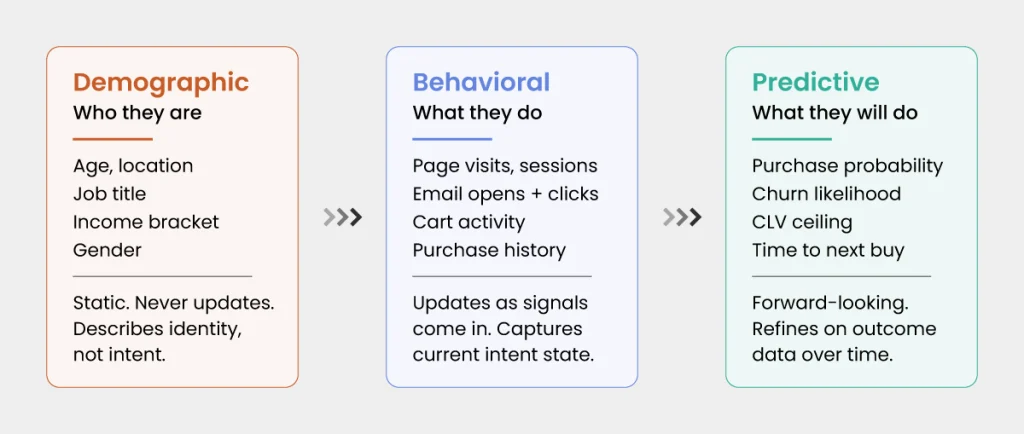
Demographic segmentation answers: who is this person? It describes an attribute. Age, location, job title, income bracket. Useful for media buying. Not useful for campaign logic.
Behavioral segmentation answers: what has this person done, and when? A customer who visited the pricing page three times in 48 hours is in a different intent state than someone who last engaged six weeks ago. Demographic data cannot see that distinction. Behavioral data captures it automatically.
Predictive segmentation answers: what will this person do next? Propensity models trained on historical behavior estimate purchase probability in the next 30 days, churn likelihood, time to next conversion, and LTV ceiling. Instead of targeting people who match a profile, you target people who are statistically likely to take a specific action.
The key difference is not the data. It is the direction.
- Demographic: static, backward-looking, describes a type of person
- Behavioral: live, signal-driven, describes a current intent state
- Predictive: forward-looking, model-driven, describes a likely future action
The transition does not require abandoning demographics. It requires shifting which layer does the primary work of determining who receives what, and when.
The RFM Model
RFM is the most battle-tested behavioral segmentation framework in commercial use. The ‘Recency, Frequency, Monetary Value Segmentation’. It is also the one most teams implement incorrectly.
The three dimensions:
Recency measures how recently a customer took a meaningful action. It is the most predictive single variable for near-term conversion probability. High recency customers are engaged and reachable. Low recency customers require a different campaign strategy entirely.
Frequency measures how often a customer transacts or engages over a defined window. High-frequency customers have demonstrated a reason to return. Low-frequency customers may be one-time buyers, drifting contacts, or category browsers who never fully converted.
Monetary value measures cumulative spend over the same window. Combined with frequency, it separates high-value occasional buyers from high-frequency low-spend customers. These segments have completely different economics and respond to completely different campaign logic.
Scoring it:
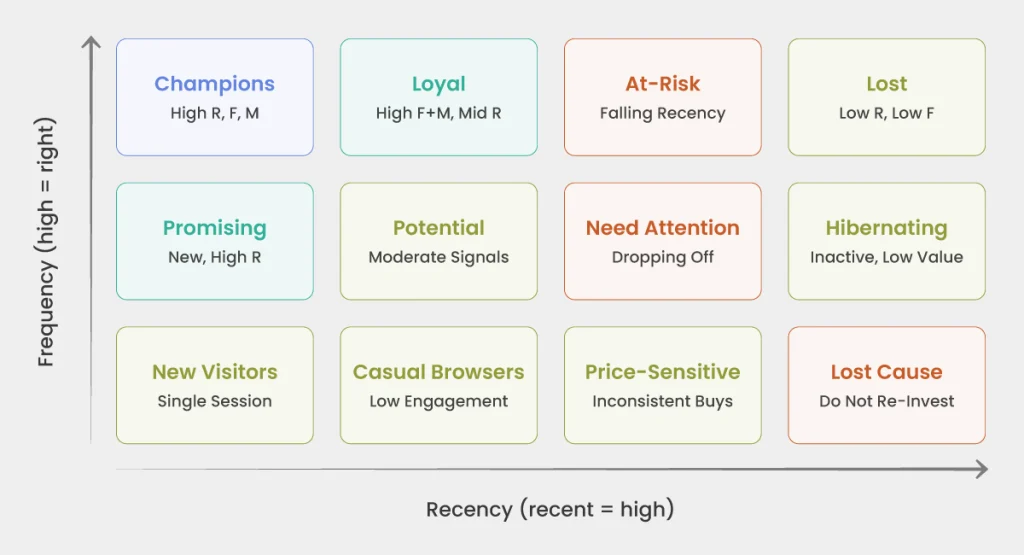
Assign each dimension a score from 1 to 5 based on relative performance within your customer base. A Recency score of 5 means purchased very recently. A Monetary score of 1 means lowest spend quintile. Combine into a composite: 555 is a Champion. 111 is lapsed.
The segments that matter operationally:
- Champions (555, 554, 545): Highest-value, most recent, most frequent. They do not need acquisition messaging. They need loyalty recognition and early access. Overmarketing this segment erodes it fast.
- Loyal Customers (high F+M, moderate R): Recency has slipped. A win-back with product updates or a loyalty reward frequently reactivates this group.
- Promising (high R, low F, moderate M): New customers with recent activity. The window to convert one-time buyers to repeat purchasers is open. Onboarding sequences and early cross-sell belong here.
- At-Risk (historically high FM, dropping R): Customers who used to be Champions but recency is falling. Your most urgent intervention segment. Retaining an at-risk customer costs significantly less than acquiring a new one.
- Hibernating and Lost: Different resource allocation decision. Is the expected reactivation revenue worth the cost? RFM makes that calculation quantitative, not intuitive.
The most common mistake: treating all RFM segments with the same message cadence and creative. RFM defines who. It does not define what. A Champion and an At-Risk customer share nothing in terms of what should land in their inbox.
Building Segments that Predict Future Behavior, Not Just Describe Past Actions
Descriptive segments confirm a state. Predictive segments determine an action.
A descriptive segment says: this customer bought in the last 30 days, browsed category X, spent more than $500 cumulative. Confirmed. Now what?
A predictive segment says: this customer has a 78% probability of purchasing in the next 14 days, based on pattern matching against historical converters. Now you know what to do, and when.
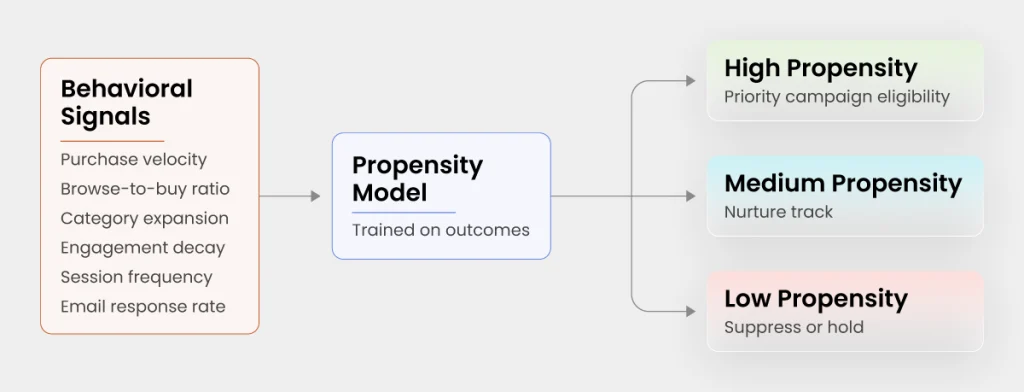
Four signals predictive models rely on most:
- Purchase velocity change: Accelerating interval = increasing value. Lengthening interval = early churn signal. Detectable before it registers in the RFM score.
- Browse-to-buy ratio: High browse, no conversion over a threshold period signals price sensitivity or decision friction. High browse with recent conversion signals active brand engagement. Not the same audience.
- Category expansion: A customer purchasing across multiple categories has a structurally higher LTV ceiling. Category expansion is a leading indicator of loyalty.
- Engagement decay: Open rates, click rates, and session frequency falling across successive periods signals disengagement before the customer goes dark. This is your highest-value intervention window, and most teams miss it.
Building predictive segments:
Most modern CDPs and marketing automation platforms include propensity scoring as a built-in feature. Custom model development is not the barrier. What you need:
- Clean behavioral data with sufficient historical volume
- Feedback loop returning campaign outcome data to refine scores
- Three eligibility tiers: high propensity, medium propensity, suppress
Map your CDP’s built-in purchase likelihood or churn risk scores to those three tiers. Build campaign eligibility against them. Measure conversion by tier. Adjust the thresholds based on observed outcomes. That is predictive segmentation at a practical scale.
Dynamic Segmentation: Letting Customers Move Between Segments Automatically
Static segments are a snapshot. Dynamic segments are a live map.
A static segment runs on a fixed rebuild interval: nightly, weekly, or at send time. The problem: customer behavior does not wait for your refresh cycle.
A customer who converted yesterday is still in the “at-risk” segment if the rebuild runs nightly and your campaign fires in the interim. They receive a win-back email the morning after they purchased. That is not a personalization failure. That is a segment architecture failure.
Dynamic segmentation evaluates membership continuously. When a customer’s signals cross a defined threshold, they enter or exit a segment in real time. The trigger fires against the current state, not a cached one.
The four rules every dynamic segment needs:
- Entry condition: Precise behavioral definition, not a label. Not “high intent.” “Three or more visits to the pricing page within a 48-hour window with no conversion event.” Precision separates signal from noise.
- Exit condition: Equally important, more often neglected. A customer must exit a segment when the triggering condition no longer holds or when a conversion event has occurred. Without exit logic, customers accumulate in segments they no longer belong in.
- Cooldown rule: Prevents a customer from entering and re-entering a trigger-eligible segment repeatedly within a short window. Without it, a customer who repeatedly visits without converting receives an unbroken sequence of high-intent messages.
- Suppression sync: A customer who converts must be removed from all pending conversion-oriented triggers within the same session, not the next batch cycle. This requires real-time sync between the CDP and every downstream activation layer: email, paid, push, web.
What dynamic segmentation requires at the infrastructure level:
Real-time or near-real-time event ingestion. Hourly or nightly batch cannot support dynamic segmentation because the signal latency exceeds the relevance window for most high-intent behaviors.
A segment evaluation engine that re-runs membership rules on incoming events, not on a schedule. Most enterprise CDPs support this natively. The gap is almost always configuration and data pipeline health, not platform capability.
A suppression SLA with a named owner. Without a defined SLA from conversion event to suppression confirmation across all channels, nobody is accountable for whether the sync is actually working.
Testing and Refining Segments Based on Campaign Performance Data
Segments that never get tested against campaign outcomes are not segmentation strategies. They are hypotheses held indefinitely.
Campaign-level engagement metrics do not tell you whether the segment definition is working. Open rates and click rates measure creative and subject line. Segment performance is measured at the segment level.
The four metrics that diagnose segment quality:
- Conversion rate by segment: If a high-intent segment converts at the same rate as your general list, the threshold is too low, the signal is too weak, or the time window is too wide.
- False positive rate: The proportion of segment members who entered based on a behavioral signal but did not exhibit the predicted behavior within the expected window. High false positive rate = the definition is picking up noise. Tighten the threshold.
- Suppression rate: The proportion excluded from a trigger because a conversion already occurred. A high suppression rate is healthy. It means your exit conditions are working. A suppression rate of zero is a red flag.
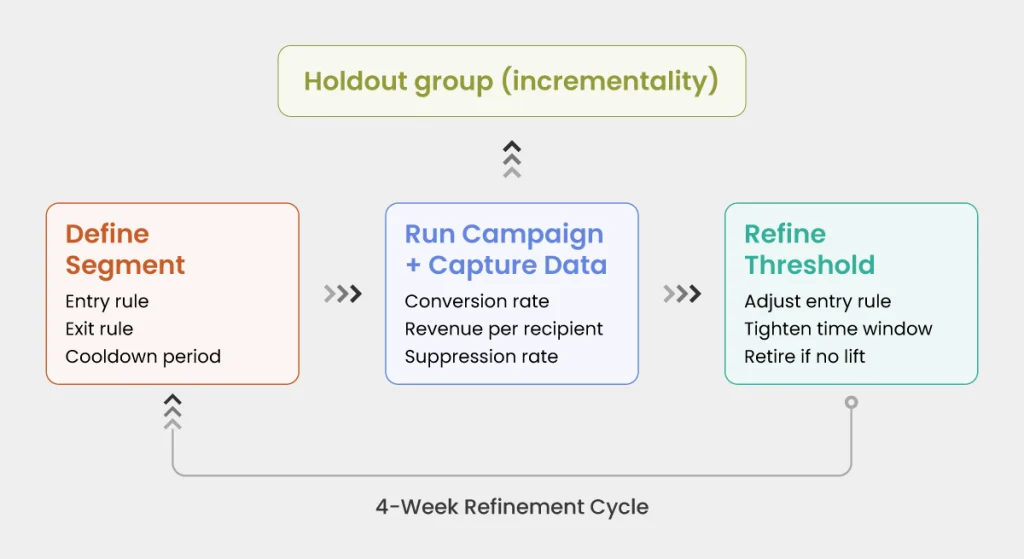
- Incrementality: Does the segment drive better outcomes than no targeting at all? This requires a holdout group: a randomly selected portion of the segment that receives no campaign treatment. The conversion delta between treated and holdout is the true lift attributable to segmentation logic. Without a holdout, you cannot distinguish between the campaign driving conversion and the segment capturing customers who would have converted anyway.
The refinement cadence:
Run a segment performance review on a four-week cycle. For each live segment: conversion rate, false positive rate, suppression rate, revenue per recipient, compared against the prior cycle. Adjust one variable at a time: entry threshold, time window, or cooldown period. Changing multiple variables simultaneously means you cannot attribute the performance delta to a specific change.
Retire segments that consistently underperform. Not every behavioral hypothesis will prove out. A segment that runs for three cycles without meaningful conversion lift above the holdout baseline is a failed hypothesis. Retire it, document the finding, apply the learning to the next iteration.
Finally: Segmentation as a System, Not a Setup
The brands that double campaign performance through segmentation have not found a better demographic filter.
They have built segmentation as an operational system. Behavioral signals feeding dynamic membership rules. Predictive scores adjusting eligibility thresholds. Suppression logic keeping pre-conversion messages away from customers who already converted. A regular performance review cycle refining every variable against observed outcomes.
Segmentation is not configured once and left running. Every segment definition is a hypothesis about what drives customer behavior. Every campaign is a test of that hypothesis.
The RFM framework gives you the behavioral foundation. Dynamic rules keep it current. Predictive scoring gives you forward visibility. Outcome-based refinement turns campaign data into a feedback loop that makes every subsequent segment more precise than the last.
At Krish, our MarTech services are built around exactly this architecture: behavioral data infrastructure, CDP configuration for dynamic segmentation, predictive model integration, and measurement frameworks that connect segment-level performance to revenue outcomes. Because a segmentation strategy that cannot answer “which segment definition drove this conversion, and how do we know?” is not a strategy. It is an assumption with a send button on it.
Table of Content
- The Target Group Problem Nobody Talks About
- Beyond Demographic Segmentation
- The RFM Model
- Building Segments that Predict Future Behavior, Not Just Describe Past Actions
- Dynamic Segmentation: Letting Customers Move Between Segments Automatically
- Testing and Refining Segments Based on Campaign Performance Data
- Finally: Segmentation as a System, Not a Setup
Subscribe with Us!
Never miss any post, stay tuned!
Ankit helps brands navigate their digital maturity journey by bringing together analytics, CRO, ML, and AI in a practical, business-friendly way. Having worked with global teams across industries, he focuses on simplifying complex MarTech concepts and turning them into measurable outcomes. On weekends, you’ll likely find him deep in a reflective read or sharing a coffee with a client while simplifying MarTech in the most human way possible.
Recommended Reading:
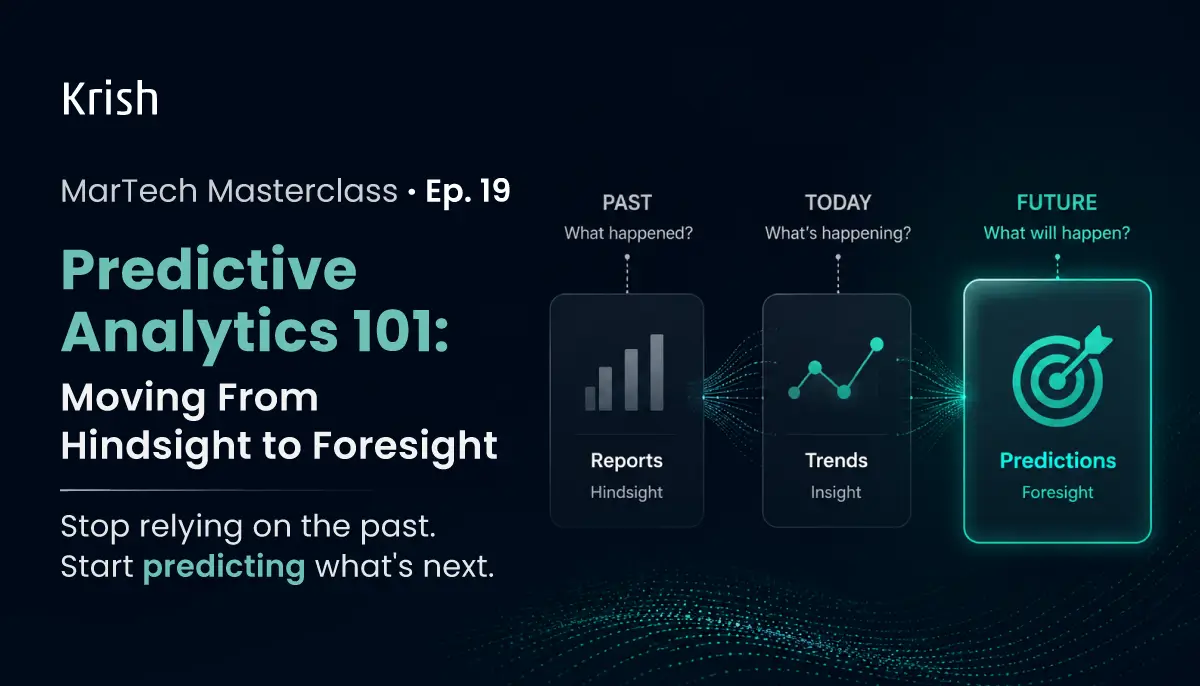
Predictive Analytics 101: Moving From Hindsight to Foresight – MarTech Masterclass Series Ep | 19
9 July, 2026 Most MarTech stacks are architecturally optimized for one thing: describing the past. Revenue last quarter, churn in the last 90 days, campaign performance last week - the dashboards are polished and the data looks clean. Yet every output from that stack is a response to something that has already happened. The customer already churned. The demand spike already passed. The high-value cohort already drifted before anyone noticed.
Subscribe with Us!
Never miss any post, stay tuned!
Trusted by leading brands


