
When Analytics Reports Stop Reflecting Reality
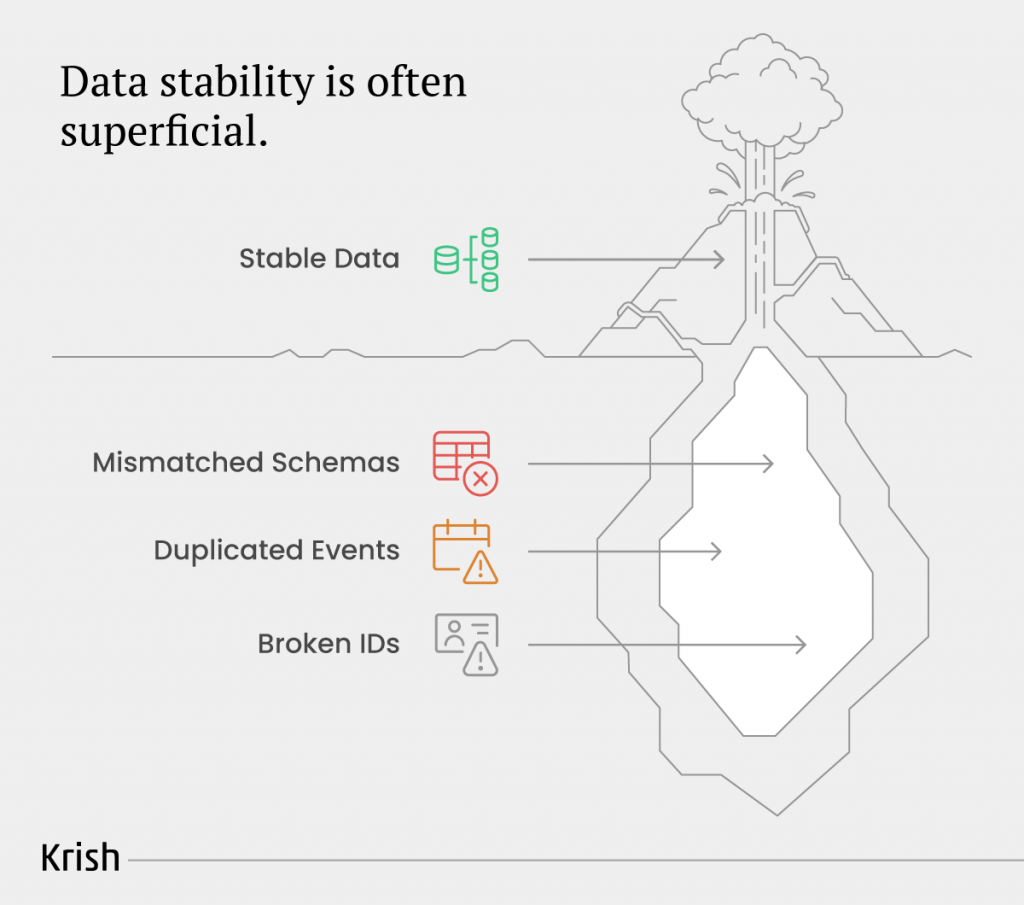
Every organisation today believes it is data-driven. Yet very few realise how often the data feeding their dashboards has already drifted from reality long before anyone notices. The real risk is not when reports break visibly. The real risk is when analytics continues to operate normally on top of a foundation that is quietly becoming structurally unreliable.
Poor data quality has become a measurable business liability. Gartner estimates that organisations lose an average of $12.9 million per year due to data quality failures, a figure that has remained consistently high as digital operations become increasingly complex.
These losses do not come from dashboards showing wrong numbers. They come from decision systems that look stable, reports that appear trustworthy, and trends that seem logical, even though the underlying data model has already fractured.
When analytics stops reflecting real customer behaviour and begins reflecting the flaws in its own architecture, we experience a subtle but powerful shift. Decisions that once felt fact-based begin pushing the organisation in the wrong direction:
- Media budgets move toward the wrong channels.
- Product teams chase problems that do not exist.
- Forecasting becomes unstable.
- Automation systems such as AI bidding and personalisation engines begin reinforcing inaccurate signals.
This happens because,
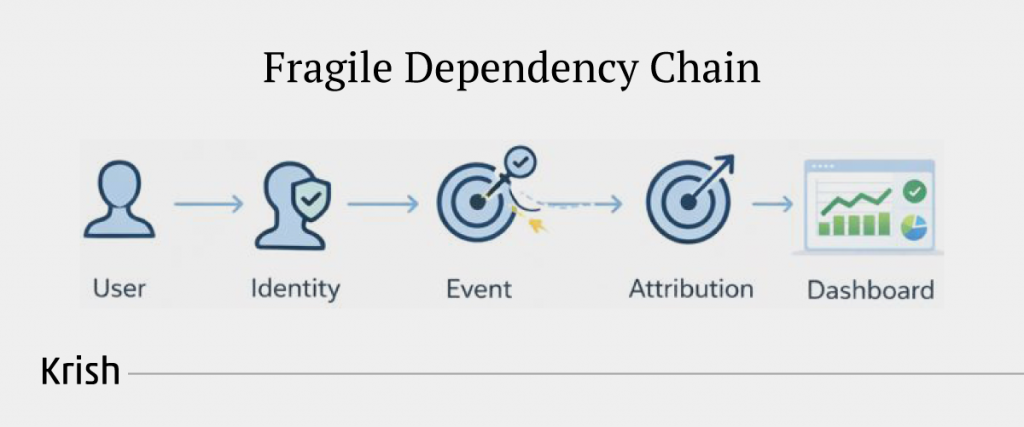
Modern analytics has a fragile dependency chain. Identity stitching, event quality, session continuity, attribution logic, cross-domain controls, and data layer integrity all influence the accuracy of every metric that leaders rely on. When any link in this chain begins to fail, the data continues to flow, but its truthfulness does not. The result is what many large enterprises unknowingly operate on today. Highly sophisticated reporting built on structurally unsound inputs.
Why This Episode Matters (Key takeaways)
In the previous masterclass episode, we exposed the 10 GA4 configuration mistakes that quietly corrupt analytics. This episode goes deeper.
It looks beyond tools and settings to reveal why analytics stops reflecting reality even when everything appears to be working. You’ll see how small gaps in data collection, identity, and event design compound over time and slowly reshape the truth inside your reports. By the end of this episode, you’ll understand:
- where data breaks first, before errors ever surface
- why different teams can report different numbers and still feel confident
- how missing events and fragmented identity distort growth decisions
- and what leaders must do to restore trust in analytics without getting technical
Are we making decisions based on customer behaviour or based on the hidden gaps inside our data architecture? If the answer is uncertain, this MarTech Masterclass episode 3 will show exactly where these hidden gaps originate and how they silently reshape the truth inside your reporting systems.
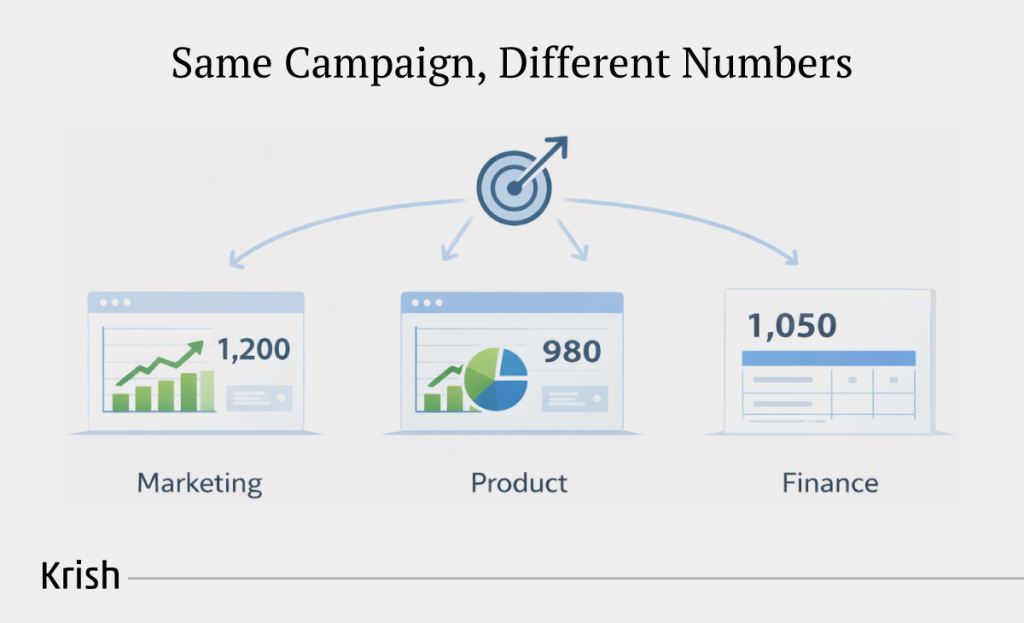
Why Two Teams Can Report Different Numbers and Both Be Correct
One of the earliest and most visible symptoms of structural data issues is when different teams report different numbers for what appears to be the same metric. Most executives interpret this as a reporting inconsistency. In reality, it is a sign that the organisation is no longer working from a unified definition of truth.
This problem does not originate in dashboards. It originates in the mechanics of how data is collected, interpreted, and transformed across platforms.
1. Differences in attribution logic create different realities
Marketing, product, CRM, and BI tools rarely interpret customer actions in the same way. Even when teams believe they are aligned on a KPI such as conversions, revenue, or engagement, the underlying attribution rules differ.
Google states explicitly that attribution models distribute conversion credit in different ways, and therefore “your reports may look different when you switch models.”
If Team A uses data-driven attribution with a 90-day lookback and Team B uses last click with a 30-day window, they are not disagreeing. They are measuring different phenomena.
2. Identity stitching varies across platforms
Identity stitching is the most common source of mismatch between analytics, CRM, and BI teams. When identity breaks across devices, browsers, or domains, the same customer appears as multiple users in one dataset and as a single unified profile in another.
The Winterberry Group reports that the complexity of cross-platform identity has risen significantly and that organisations increasingly struggle to maintain consistent identity graphs across channels and tools, which leads to diverging user-level metrics between teams. If identity behaves differently across systems, user metrics, retention, and journey reports will never align.
This means teams pulling user numbers from analytics, CRM, or CDP platforms are often analysing different identity graphs, not different interpretations of the same customers.
3. Analytics platforms apply different measurement rules
Google Analytics, Adobe Analytics, and server-side solutions do not measure sessions the same way. They apply different rules for:
- session timeout
- bot filtering
- campaign resets
- engagement thresholds
- identity persistence
If teams rely on tools with different processing rules, their session-based KPIs will not align. These methodological differences lead to routine discrepancies in sessions and conversion counts
4. Segments, filters, and definitions cause intentional variance
Segments change the underlying population you measure. Slight differences in how teams define “qualified session,” “engaged user,” or “conversion event” will produce different KPIs. Different analytics tool documentation provides general guidelines on such segments and filters. To avoid such discrepancies, a unified platform or standardised rules across teams is necessary.
5. Environment and tag drift produce parallel datasets
Staging, QA, and production containers or tag versions often diverge in mature enterprises. Governance audits find that inconsistent tag versions and broken or unsynchronised implementations cause data that looks similar but is structurally different across environments. Teams querying different environments will therefore pull different numbers.
What this means for leadership
When teams disagree on numbers, they are not necessarily wrong. They are often operating from different measurement models or datasets. The right executive question is not “who is correct” but “are we operating from a single, auditable measurement model?” Fixing this requires aligning attribution, identity, session rules, segmentation, and environment governance, starting at the data collection layer.
Next, we will examine that collection layer in detail: what the data layer is, how it fails, and why it is the most important place to look for structural corruption.
Data Layer Integrity: The Failure That Breaks Before Dashboards Notice
What is the data layer, and why does it matter?
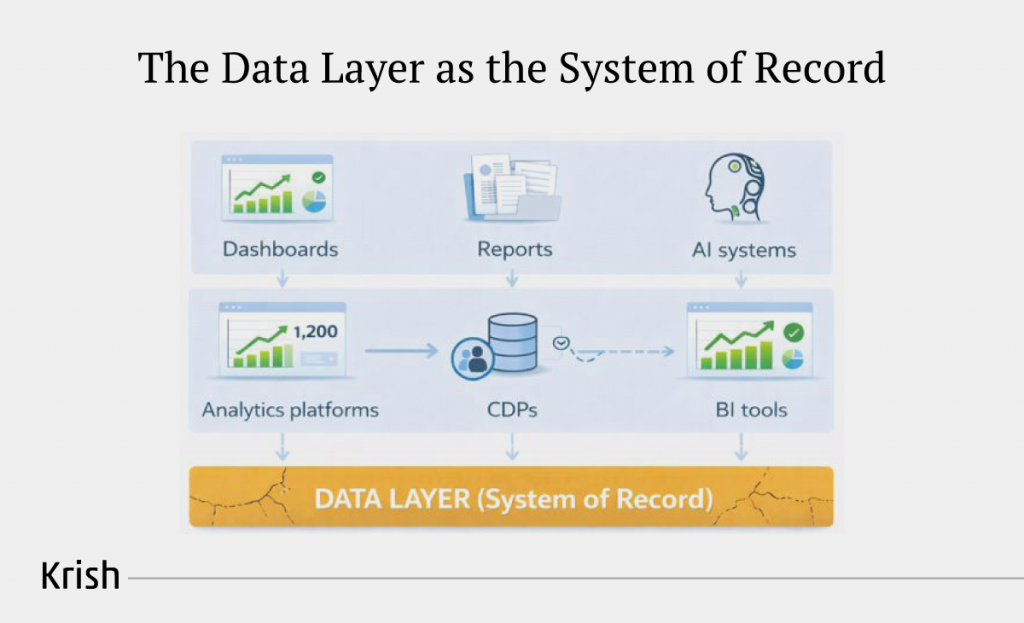
If analytics is your organisation’s sensory system, the data layer is its central nervous junction. It is the point where product truth becomes data truth. Every click, every checkout step, every identity signal enters your measurement ecosystem through the data layer. It is not a tagging convenience. It is the system of record that everything else depends on.
When this layer is unstable, analytics does not break visibly. It breaks quietly. Dashboards continue updating. Funnels continue rendering. But what you see is not your customer’s behaviour. It is the shape of the failure inside your own data pipeline.
How do data layer failures typically occur?
- Schema drift and inconsistent naming
Different teams push different versions of the same event. A purchase event carries one identifier on web and another on mobile. A login event passes user context in one flow and not another. This breaks parameter consistency and corrupts funnel, revenue, and attribution analysis.
- Race conditions and overwritten parameters
Tags, consent managers, and SPAs load asynchronously. If an event fires before the data layer is fully populated, payloads arrive incomplete. Missing transaction IDs or values create data that looks valid but cannot be trusted.
- SPA hydration and route change issues
Single Page Applications (SPAs) require explicit route tracking. Without it, page views and checkout steps disappear silently. Misconfigured consent flows further suppress events or identity parameters by region or device, skewing datasets without visible errors.
- Legacy and mixed tagging infrastructures
Hardcoded scripts, multiple tag managers, and server-side pipelines often coexist. When similar events fire with different structures, identifiers fragment, events duplicate, and session stitching breaks.
Business impacts you should care about
These failures do not create small inconsistencies. They create structural distortions.
- Conversion rates collapse because payloads miss the transaction ID or value. CFOs question revenue alignment.
- Retention and remarketing models underperform because identity is incomplete or unstable. Audiences shrink.
- Forecasting loses credibility because funnels contain synthetic drop-offs created by instrumentation gaps.
- Media decisions shift in the wrong direction because attribution receives corrupted inputs.
As mentioned earlier, enterprises lose millions due to poor data decision-making, which is explained here. These costs begin at the data layer long before they show up in financial reports.
How to detect data layer failure quickly
Executives do not need to inspect code to recognise data layer drift. These tests uncover problems within hours.
- Ask for a single documented event schema. If it does not exist, fragmentation is already present.
- Run a synthetic journey and verify that the same events produce the same payloads each time.
- Inspect high-value events for missing IDs or values. Empty fields signal race conditions.
- Validate identity consistency across analytics and CRM. Intermittent IDs guarantee misalignment.
- Confirm staging, QA, and production use the same implementation. Environment drift is a common enterprise failure.
If even two of these checks fail, your analytics is giving you confidence, not truth. That is why the next failure is even harder to detect: missing and partial events.
The Missing Events That Create Blind Spots in Your Analytics
A broken event is still detectable, but a missing event is not – this is the core danger!
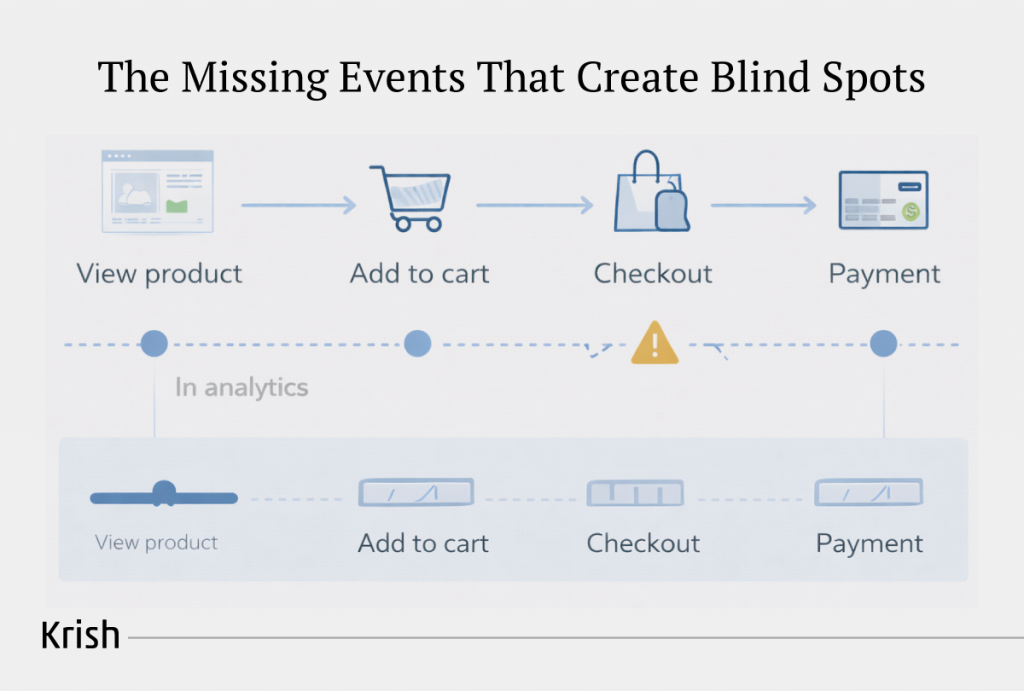
When a critical interaction never reaches your analytics stack, you do not see an error. You see an incomplete version of the customer journey that still looks perfectly coherent. Leadership sees clean funnels, stable conversion trends, and predictable attribution patterns. Nothing seems off. But the story you are reading is missing chapters.
Industry audits consistently find silent event loss as one of the top drivers of inaccurate funnels. Snowplough highlights the phenomenon of “false stability”, where incomplete events produce dashboards that look healthy but are structurally untrue.
Where Missing Events Commonly Occur?
- Check out the steps that never fire
Payment pages, address forms, and delivery selections are often implemented with conditional rendering or third-party widgets. If these components do not push events at the correct lifecycle moment, your funnel skips entire steps.
E-commerce audits show that checkout steps are among the most frequently missing events in enterprise setups, often due to component-level implementation variance.
- Add-to-cart actions tied to dynamic elements
Modern product pages rely on JavaScript-driven interactions. If the click handler changes or the UI updates without updating the data layer logic, add-to-cart events stop firing silently. The result is misleading product performance reporting and CRO teams chasing the wrong issues.
- Route changes inside SPAs
This is the single largest blind spot. If route changes do not push virtual pageviews, your analytics believes users stopped moving even as they continue navigating. Funnels show inflated exits that never happened.
SPA migration case studies repeatedly demonstrate this problem, especially on React and Angular builds.
- Server-side tagging that drops parameters
Server-side setups promise cleaner data, but transformation errors, client misconfigurations or untested forwarding rules can cause entire parameters to disappear.
Product metadata, currency fields or identity attributes drop out of the payload before the event ever reaches analytics.
- Consent flows that block high-value events
When a CMP is misconfigured, it can suppress events for users who accept tracking while allowing events from those who deny.
This leads to misleading performance signals that appear tied to geography, device type, or demographic, when the root cause is instrumentation error.
CMP audit reports show this pattern frequently, especially in multi-region deployments.
How These Blind Spots Reshape the Customer Journey in Your Data
Missing events do not simply hide actions. They distort entire narratives:
- Funnels show drop-offs that never happened.
Teams spend months optimising pages that customers did not actually abandon. - Marketing looks ineffective.
Channels appear to drive traffic but not conversions because the conversion events never arrive. - Products look underutilised. Key features appear irrelevant when, in reality, the tracking for those interactions quietly disappeared.
- Forecasting models flatten.
When event sequences are incomplete, retention, repeat purchase and engagement predictions lose signal strength.
And because the data still “looks stable”, these distortions often go unnoticed for months.
Why Missing Events Are More Dangerous Than Wrong Events
A wrong event at least shows up, but a missing event creates a false interpretation that seems entirely valid.
This is why analysts describe missing events as the “dark matter” of analytics. They influence everything without being seen directly. Every downstream model, audience, and attribution system works with a story that excludes the events that never fired.
For leadership, this means the business is optimising for a version of reality that is not happening.
How to Quickly Identify Missing Events Before They Spread
Your teams can detect missing events quickly by testing these four checkpoints:
- Journey coverage tests
Map the top five revenue-driving flows. Ask for proof that every step fires an event. Most gaps appear in steps that were updated by engineering after the analytics specification was written. - Synthetic session replay
Simulate a complete end-to-end journey and capture the event stream. If the journey has twelve customer actions and analytics shows nine, you know where to investigate. - Parameter completeness checks
Missing parameters are an early sign that the event structure is failing. When one parameter disappears, others often follow. - Cross-tool reconciliation
Compare analytics, CRM, and backend conversions for a single day. If analytics consistently show lower conversion counts, you are losing events before they reach the platform.
These are simple, high-impact checks leadership can mandate without touching code.
Missing events only explain half the story. The other half is identity. Even when events fire correctly, the same user may appear as three different people across devices and domains. In the next section, we look at how identity fragmentation distorts lifetime value, retention, personalisation, and attribution at scale.
User Identification Challenges That Fragment the Customer Story
Missing events distort the shape of your data, but broken identity distorts the meaning of it. This is the failure that leaders feel the most. Revenue looks inconsistent. Retention looks weaker than reality. Returning customers appear as “new users.” Personalisation systems underperform. Remarketing costs rise for no clear reason.
When identity breaks, the business stops analysing customers and starts analysing fragmented profiles. GA4, CDPs, CRMs, and ad platforms each tell a different version of the same user’s journey. In most enterprises, this is happening silently at scale.
Why is identity the hardest part of analytics to get right?
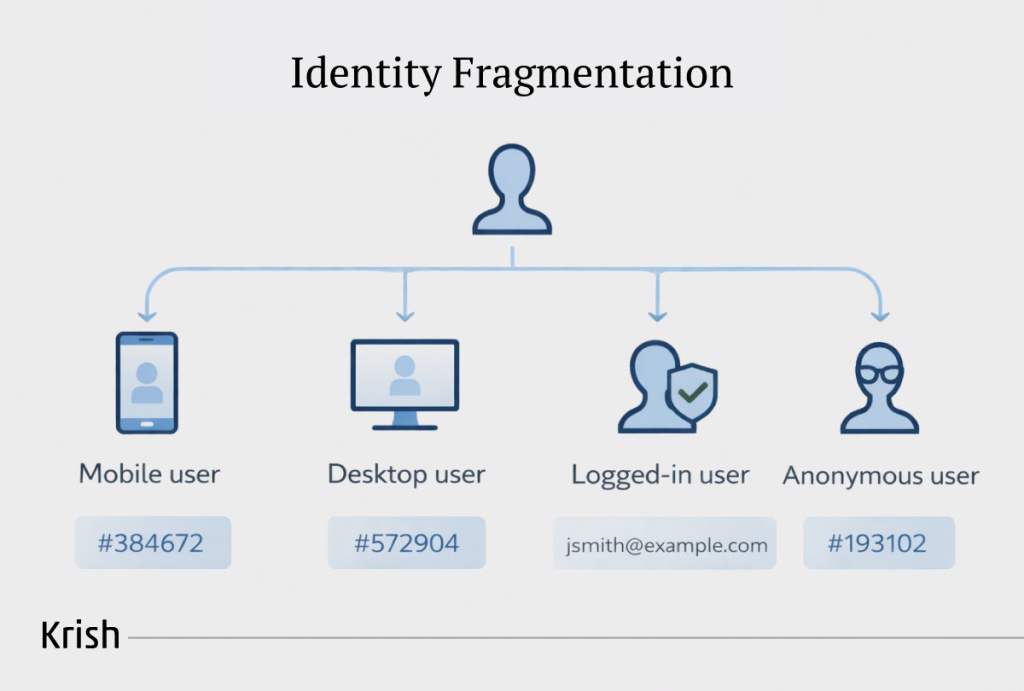
Identity is not one field. It is a sequence of decisions about how a user is recognised across sessions, devices, domains, and authentication states. Each of these decisions needs to be consistent. The moment any part of that chain breaks, analytics creates a new profile for the same human.
Industry analyses highlight identity resolution as one of the most complex challenges in modern measurement because identifiers, cookies, and matching logic vary widely across platforms. It is the single biggest reason user counts differ between analytics tools and CRM systems.
If identity is unstable, the entire customer narrative is unstable.
How does identity fragmentation happen inside most organisations?
1. Cross-domain journeys split users into multiple profiles
If your business spans multiple domains or subdomains, every domain transition has the potential to break identity unless stitching is configured correctly. Return URLs from payment gateways, authentication domains, or checkout services often reset identifiers. Analytics then sees the same person twice: once as a customer, once as a stranger.
2. Device switching creates duplicate users
Customers move between mobile, desktop, and app. If login events are not consistently captured or the user ID is not applied early enough in the session, each device creates a separate identity record. Your analytics then shows inflated new user counts and deflated returning user behaviour.
3. CRM, CDP, and analytics use different identifiers
- CRM may rely on email.
- Analytics may rely on the client ID.
- CDP may rely on a hashed identifier.
If these systems never converge on a single logic, they produce contradictory customer histories. Attribution, LTV, and segmentation become incomparable.
4. Authentication logic is inconsistent across platforms
Some properties wait until checkout to set the user ID, others set it at login. Mobile may set it differently from the web. Server-side endpoints may overwrite the identifier without validation. The result is the most common identity drift in enterprise setups: one customer, multiple user profiles, each telling a different behavioural story.
5. Server-side tagging modifies or drops identifiers
Server-side pipelines can be powerful, but misconfigured clients or transformations often drop identity parameters unintentionally. Analytics receives clean-looking events that have no continuity across sessions.
This results in complete customer fragmentation even while the dashboards appear stable.
What does identity fragmentation do to your business?
This is where the business impact becomes visible.
- Lifetime value becomes inaccurate.
If a customer appears as multiple users, their purchase history splits. LTV models cannot predict the true value. - Retention looks weaker than reality.
Returning customers are counted as new visitors. Retention strategies look ineffective even when customers are loyal. - Attribution undervalues the first half of the journey.
If the early part of the journey belongs to one identity and the conversion belongs to another, your acquisition channels are under-credited by design. - Personalisation loses power.
If identity drifts, personalisation tools cannot recognise context, intent, or previous actions. Email, on-site recommendations, and ad audiences degrade. - Your marketing spend becomes less efficient.
Platforms optimise on incomplete signals. This increases remarketing cost and reduces conversion performance over time.
Identity failures do not create noisy data. They create a broken version of the customer that your entire business learns from.
How can leaders recognise identity issues immediately?
You do not need engineering to confirm identity fragmentation. Look for these three symptoms:
- Analytics’ new users are growing, but CRM customer growth is stable.
This usually means returning customers are being counted as new. - Attribution reports under-credit upper funnel campaigns.
This often happens when the early journey belongs to a different identity profile. - Retention and repeat purchase rates fluctuate without a business cause.
Identity drift frequently mimics retention decline.
If any of these symptoms appear, identity resolution needs immediate attention.
Identity fragmentation shows how analytics can misrepresent your customers even when everything appears stable on the surface. But there is a deeper layer of complexity. Some failures do not come from missing events or user duplication. They come from advanced architectural misalignments that even mature teams rarely detect. In the next section, we explore those hidden system-level misconfigurations that silently degrade decision quality at scale.
The Advanced Misconfigurations Even Mature Teams Miss
By the time an organisation reaches measurement maturity, the obvious tracking mistakes are usually gone. What remains are deeper architectural issues that look harmless on the surface but quietly distort the truth beneath every dashboard. These failures do not break analytics. They bend it. And that is far harder to detect.
When the same event means different things across your ecosystem
In large teams, event definitions drift over time.
- A “purchase” on the web passes transaction details.
- A “purchase” on the app passes only the action.
- A server-side pipeline may add or remove fields entirely.
Individually, these changes seem minor. Together, they break the assumption that one business event represents one business action. Analytic Partners has shown how inconsistent inputs materially distort attribution and lead to misallocated budgets across channels.
When your events lose semantic consistency, your insights lose structural integrity.
When environments fall out of sync and create competing versions of truth
Staging, production, and mobile rarely move in perfect lockstep.
- Tags update at different times.
- Schemas drift.
- Legacy containers remain active longer than intended.
ObservePoint’s enterprise scans repeatedly show that environment drift is one of the most common causes of conflicting analytics numbers across teams. This is how two teams, both “technically correct,” end up reporting different KPIs.
When events exist but their intelligence disappears
Most companies implement the right event names. The real failure is that the events arrive incomplete. No transaction ID, no product metadata, and/or no value. Even in such cases, GA4 still counts the conversion. Dashboards still show movement, but everything built on top of that event becomes unreliable. ROAS calculations flatten, LTV models lose predictive power, and funnel insights become guesswork. It is the illusion of accuracy that causes the damage.
When identity becomes inconsistent across platforms
Identity is the connective tissue of analytics. If one system sets user ID during login, another during checkout, and a third overwrites it server-side, in such scenarios, your customer does not appear as one person anymore.
This is why:
- Returning users look new
- Retention metrics dip without cause
- Attribution loses the early journey
- Personalisation feels irrelevant
Identity drift changes not just the data but the entire understanding of customer value.
When your warehouse and analytics UI tell different stories
BigQuery or Snowflake exports are assumed to be the “source of truth.” But if schema drift or missing parameters enter the warehouse, the truth fractures. Analysts build models on one set of assumptions, and marketing reads a different story in GA4. This is where leadership is left, reconciling contradictions instead of planning a strategy.
This is not a reporting dispute. It is a measurement architecture operating in two parallel realities.
Quantifying the Revenue Impact of Misconfigurations
By the time misconfigurations reach leadership, they no longer look like tracking issues. They look like performance problems. They look like budget inefficiency. They look like slow growth. Measurement failures do not show up as errors. They show up as business outcomes that cannot be explained.
This is why poor analytics governance is expensive. Not because the data is wrong, but because the decisions built on that data send the organisation in the wrong direction.
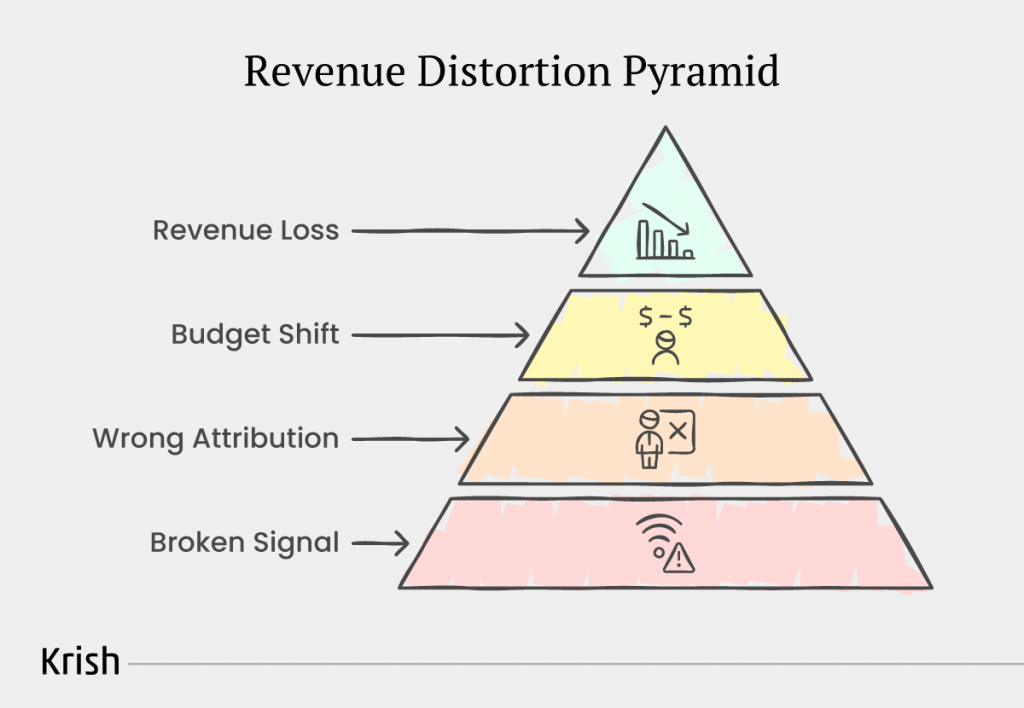
How distorted data reshapes financial performance?
- Misattributed conversions lead to wrong budget decisions
When attribution logic is fed incomplete or inconsistent event data, channels that deserve credit lose it, and channels that do not deserve credit gain it. Analytic Partners’ ROI Genome work repeatedly shows that inaccurate measurement inputs cause organisations to invest in the wrong places, reducing both short-term ROAS and long-term revenue potential. A small shift in credit assignment can redirect millions in spending over a fiscal year.
- False funnel drop-offs trigger unnecessary redesigns
When missing or partial events make a step look broken, teams commit engineering, design, and product hours to solving a problem users never experienced. The cost is not just misallocated resources. It is the opportunity cost of abandoning initiatives that would have moved the needle.
- Incomplete identity inflates acquisition costs
If identity signals break, remarketing pools shrink, and lookalike models degrade. This forces platforms to bid more aggressively to find the right users, pushing CAC upward even when demand has not changed.
- Forecasting becomes unreliable
Revenue predictions fail when the underlying event sequence is inconsistent. LTV models flatten. Cohort behaviour appears weak. Retention curves wobble. Finance teams respond by padding estimates, reducing confidence in growth plans. This is how analytics noise becomes financial volatility.
Why do organisations discover the impact too late?
Most companies do not realise data misconfiguration is costing them money until one of three things happens:
- Revenue and analytics no longer align.
Finance sees discrepancies between backend sales and analytics-reported performance. - A new team inherits the analytics setup.
Fresh eyes immediately notice schema drift, broken identity logic, or missing conversion parameters. - A major campaign underperforms without explanation.
Marketing suspects the creative, audience, or competition. Only later do they discover the tracking foundation was unstable.
By the time the root cause is identified, the business has already acted on the damage.
The leadership takeaway
Analytics misconfiguration is not a technical problem. It is a budget problem. It is a forecasting problem. It is a growth problem! Attribution shifts, funnels mislead, identity fragments, decisions drift, and the organisation pays for it through misaligned investment and lost opportunity.
Now that we understand the financial impact, the next question is pattern recognition. Let’s identify the telltale signs in real-world analytics audits that indicate an organisation is already drifting.
The Failure Patterns That Show Your Analytics Is Already Drifting
By the time a misconfiguration becomes visible in your dashboards, the underlying issues have usually been present for months. Mature organisations rarely suffer from one-off mistakes. They suffer from recurring patterns that quietly distort their data in predictable ways.
These patterns surface across enterprise audits regardless of industry, team size, or analytics maturity. They are the markers that your measurement foundation is no longer telling the real story of your business.
1. Funnels that show drop-offs unrelated to real customer behaviour
A sudden spike in abandonment at a step that has not changed is rarely a UX issue. It is usually a visibility issue. When events disappear or fire incomplete payloads, the funnel loses continuity and creates the illusion of customer hesitation. Teams then optimise around a problem that does not exist while the real failure sits in the tracking infrastructure.
2. Returning customers are treated as new users
When analytics shows rising new-user volume while CRM shows stable customer growth, the gap points to broken identity stitching. Users who move across devices, domains or login states are being treated as separate profiles. The result is inflated acquisition numbers, understated retention performance, and growing confusion about what is actually driving loyalty.
3. Revenue discrepancies between backend systems and analytics
Executives often see mismatched revenue totals and assume an attribution issue. In most audits, the cause is simpler. Analytics receives the conversion event, but critical identifiers or value parameters are missing. The sale happened. The platform just cannot recognise or associate it accurately. This leads to unreliable ROAS calculations and fractured financial reporting.
4. Channel performance shifting without a market-driven reason
When one acquisition channel suddenly appears to outperform while another declines, leadership naturally questions creative or budget allocation. But unplanned shifts often originate in the measurement foundation: broken referral exclusions, session resets or altered identifiers make channels appear more or less effective than they are. The attribution logic changes even though the customer journey has not.
5. Teams debating numbers that should match but never do
When Marketing, Product, and Data each present different numbers for the same KPI, the issue is not interpretation. It is architecture. Mismatched environments, schema drift between app and web, or inconsistent event definitions result in parallel datasets that cannot be reconciled. The organisation starts managing disagreement rather than insight.
6. Shrinking remarketing audiences despite stable traffic
When audience pools get smaller and paid efficiency drops without a corresponding change in demand, it is typically because identity or event completeness has degraded. If platforms receive fewer signals, they generate weaker models, and performance declines even though customer behaviour has not changed.
How to Audit Data Quality Without Any Technical Background
Most leaders do not realise how much they can diagnose without touching a single tag or opening a developer tool. Data quality is not exclusively a technical responsibility. It is an operational clarity issue, and many of its early warning signs are visible long before engineering becomes involved. The key is knowing what to look for and how to interpret the signals.
A practical audit does not require technical fluency. It requires structured questions, observable outcomes, and a clear understanding of what consistency should look like when analytics is working correctly. The following framework gives leaders a reliable way to assess data integrity using only the information teams already have.
1. Start with alignment: Do teams agree on the numbers
Choose one KPI such as conversions, revenue, new users, or key funnel completions. Ask Marketing, Product, and Data for the same metric for the same date range.
2. Validate that the business-critical events are clearly defined
Ask each team to provide the definitions of the top events the business relies on: add-to-cart, form submission, login, checkout steps, and conversions. What matters is whether these definitions are consistent across departments.
3. Review whether these events fire reliably across the customer journey
Complete the core customer journey yourself. Navigate the site, trigger key actions, and ask the analytics team to show which events and parameters were captured for each step.
4. Compare analytics conversions with backend numbers for a controlled time window
Choose one 24-hour period and ask for total conversions from both GA4 and your backend system.
5. Examine whether identity behaves as expected
Request three simple views: new versus returning users, users by device, and users across multiple domains if your business spans more than one. If returning users fluctuate strangely or if device-level identities look inconsistent, the stitching logic is unstable.
6. Ensure your environments are not telling different stories
Ask a straightforward question: are staging, QA, and production running the same tracking configuration right now?
7. Confirm that a measurement contract exists and is actually followed
Every organisation needs a single document that defines event naming, required parameters, identity rules, consent expectations, and environment standards. If this document does not exist, or if it exists but no one uses it, the analytics foundation will degrade over time. Consistency cannot be maintained without a shared contract.
What this audit gives you
This framework offers a leadership-level view of whether your analytics is stable, drifting, or fundamentally misaligned. None of these checks requires technical execution. They require clarity, alignment, and a willingness to confront inconsistencies before they compound.
When leaders use this structure, they quickly identify where their analytics has lost integrity and, more importantly, where governance must be strengthened. It transforms data quality from a technical mystery into an operational discipline that the organisation can manage confidently.
Once leaders understand how to evaluate the health of their analytics, the next step is ensuring that health is preserved. Now we focus on the operational practices that keep measurement stable long after implementation is complete.
The Leadership Outcome
Reliable analytics is not a technical achievement. It is an operational one. When measurement is governed with clarity, consistency, and cross-functional alignment, the organisation gains a dependable view of customer behaviour and business performance. This stability strengthens forecasting, sharpens attribution, enhances personalization, and ensures that investment decisions are grounded in truth rather than assumption.
Your digital analytics foundation will remain reliable only if your governance remains intentional. When leaders treat data quality as a strategic asset rather than a back-end responsibility, the organisation gains what most companies lack: a measurement system that can be trusted to guide real decisions.
Up next, the MarTech Masterclass Ep. 4 will highlight the top event tracking strategies to transform raw data into insights. Stay tuned!
Table of Content
- When Analytics Reports Stop Reflecting Reality
- Why Two Teams Can Report Different Numbers and Both Be Correct
- Data Layer Integrity: The Failure That Breaks Before Dashboards Notice
- The Missing Events That Create Blind Spots in Your Analytics
- User Identification Challenges That Fragment the Customer Story
- The Advanced Misconfigurations Even Mature Teams Miss
- Quantifying the Revenue Impact of Misconfigurations
- The Failure Patterns That Show Your Analytics Is Already Drifting
- How to Audit Data Quality Without Any Technical Background
- The Leadership Outcome
Subscribe with Us!
Never miss any post, stay tuned!
Ankit helps brands navigate their digital maturity journey by bringing together analytics, CRO, ML, and AI in a practical, business-friendly way. Having worked with global teams across industries, he focuses on simplifying complex MarTech concepts and turning them into measurable outcomes. On weekends, you’ll likely find him deep in a reflective read or sharing a coffee with a client while simplifying MarTech in the most human way possible.
Recommended Reading:
The 5 Machine Learning Models Every Marketing Team Should Know – MarTech Masterclass Series Ep | 20
17 July, 2026 Most marketing conversations about machine learning (ML) collapse it into a single capability. Teams talk about "using AI" or "adding ML to the stack" as though it were one tool with one function. It is not, and treating it that way is why most ML initiatives either overreach and fail or underdeliver and disappoint.
Subscribe with Us!
Never miss any post, stay tuned!
Trusted by leading brands


