Introduction
eCommerce funnels often seem efficient, but hidden drop-offs occur as users hesitate, revisit steps, or abandon purchases. These patterns aren’t visible in top-line metrics, making optimization less precise.
The challenge is not a lack of data; it is the lack of structured visibility into user movement across the funnel. Industry data shows that nearly 70% of online shopping carts are abandoned before purchase, highlighting how much revenue is lost within the funnel itself.
This is where GA4’s funnel analysis can help. Rather than treating conversion as a single event, it allows for the analysis of conversion as a series of decisions, each of which is shaped by experience, context, and friction at the time.
With this level of visibility in place, teams no longer optimize in the context of the entire funnel. Instead, they can make improvements to specific areas of the customer journey based on where things are breaking down, rather than assumptions about how the funnel works.
This guide will outline the steps to track eCommerce funnel drop-offs in GA4 in a structured manner.
What is Funnel Drop-Off in eCommerce?
An eCommerce funnel is a structured representation of user progression:
- Product view
- Add to cart
- Checkout initiation
- Purchase completion
A drop-off occurs when users fail to move from one stage to the next.
What matters is not the existence of drop-offs; every funnel has them. What matters is where they concentrate and why.
For instance, if the add-to-cart conversion is high and the checkout conversion is low, it indicates the existence of demand with poor execution. Studies show that the average eCommerce site can increase its conversion rates by 35.26% by redesigning its checkout flow. Without eCommerce funnel drop-off analysis using GA4, this distinction is invisible.
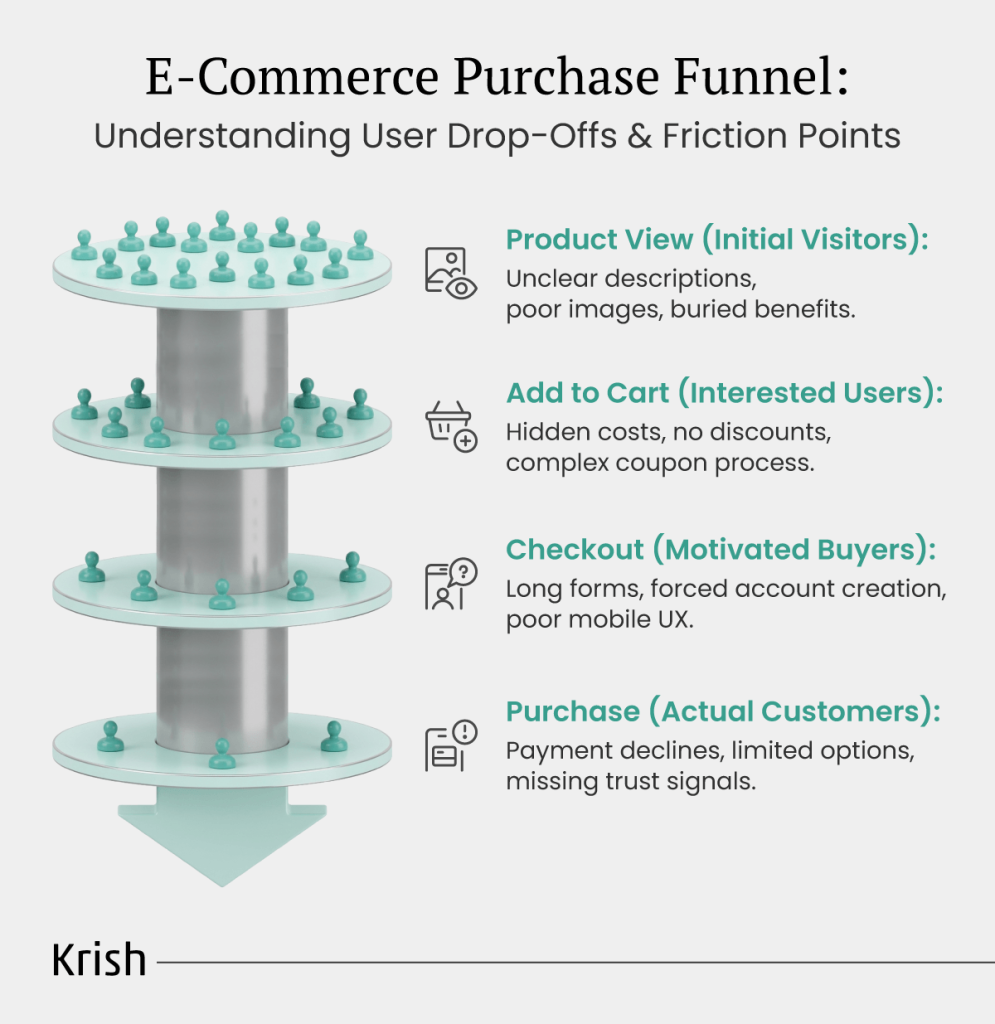
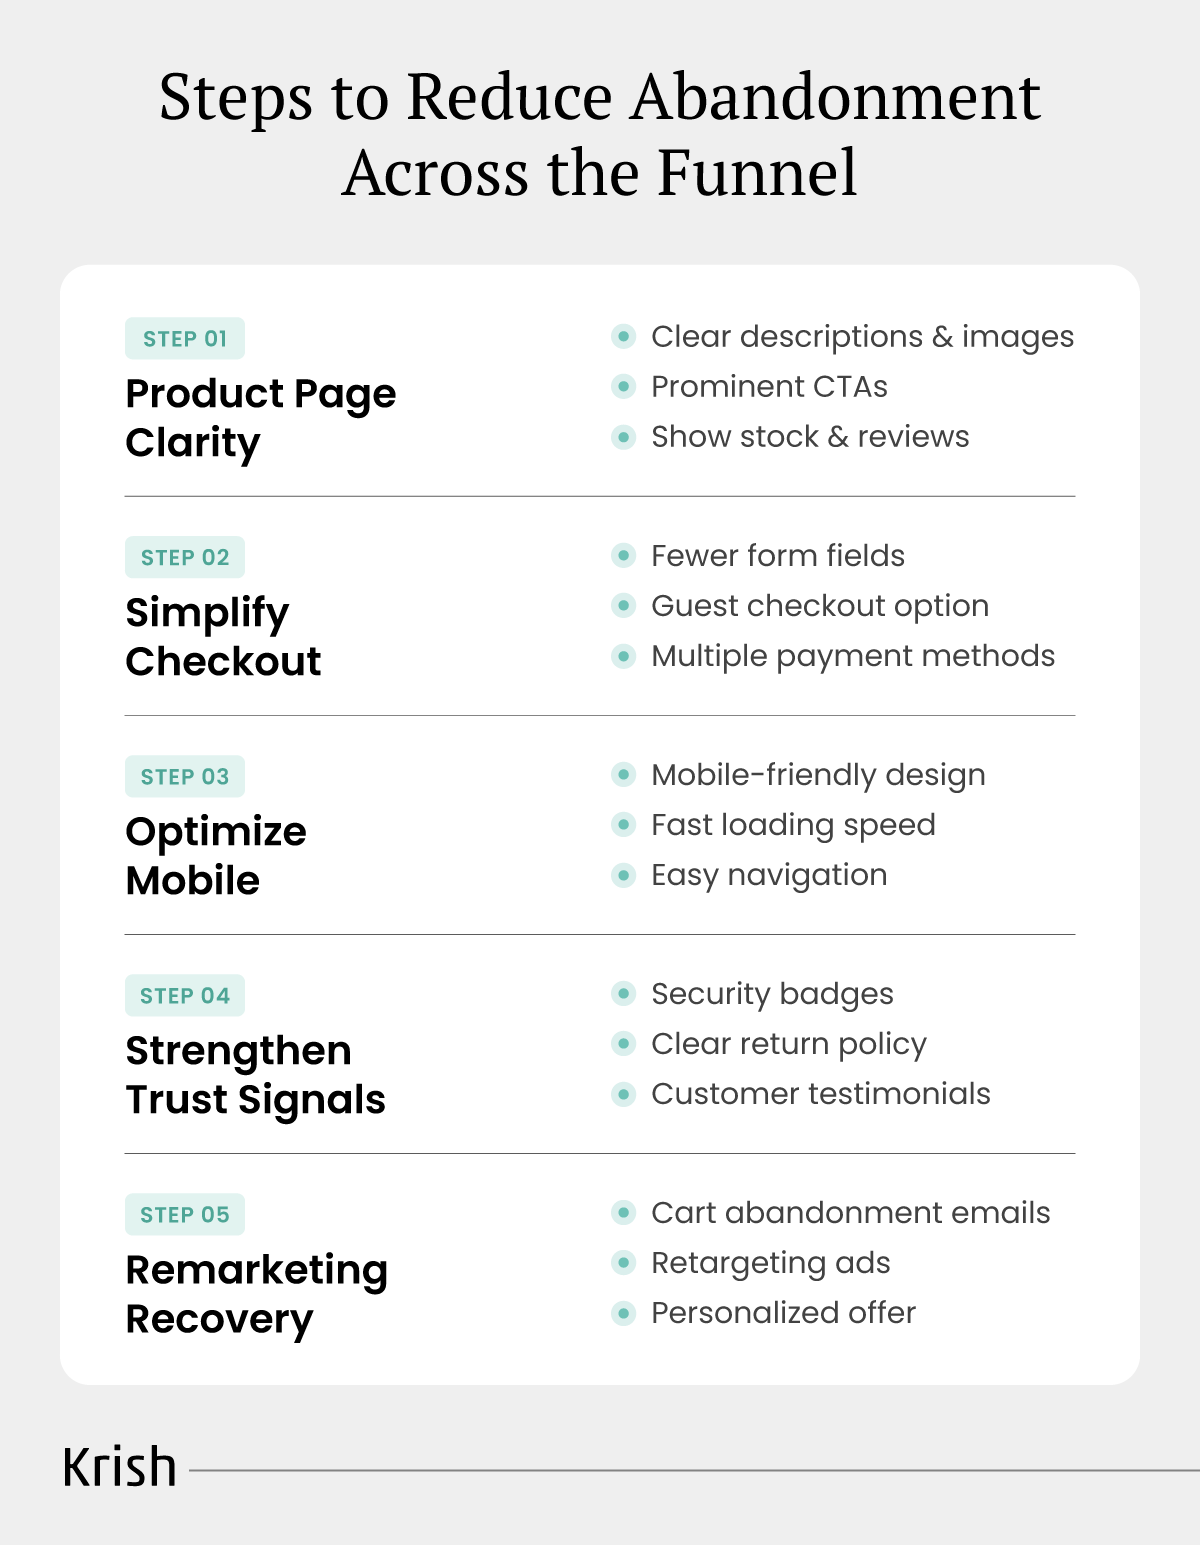
Common Drop-Off Points in eCommerce Funnels
Drop-offs are not evenly distributed. They cluster around predictable friction zones.
- Product Page: Missing details, weak differentiation, or unclear pricing cause hesitation.
- Cart Stage: Unexpected costs or unclear totals prompt abandonment.
- Checkout Process: Extra steps, forced logins, and poor mobile UX increase effort and drive exits.
- Payment Stage: Limited options, low trust, or payment failures block final conversions.
Each of these stages represents a distinct optimization problem. Treating them uniformly leads to ineffective CRO decisions.
Baymard Research shows that unexpected costs, forced account creation, and complex checkout flows are among the top drivers of abandonment.
Leave Because Of The Extra Costs
Of Users Don’t Trust The Site With Their Credit Card Information
Thinks The Checkout Process Was Too Complicated Or Too Long
Abandoned The Checkout Process Because The Site Prompted To Create An Account
Understanding GA4 Funnel Exploration
GA4’s Funnel Exploration is designed for behavioral diagnostics, not just reporting.
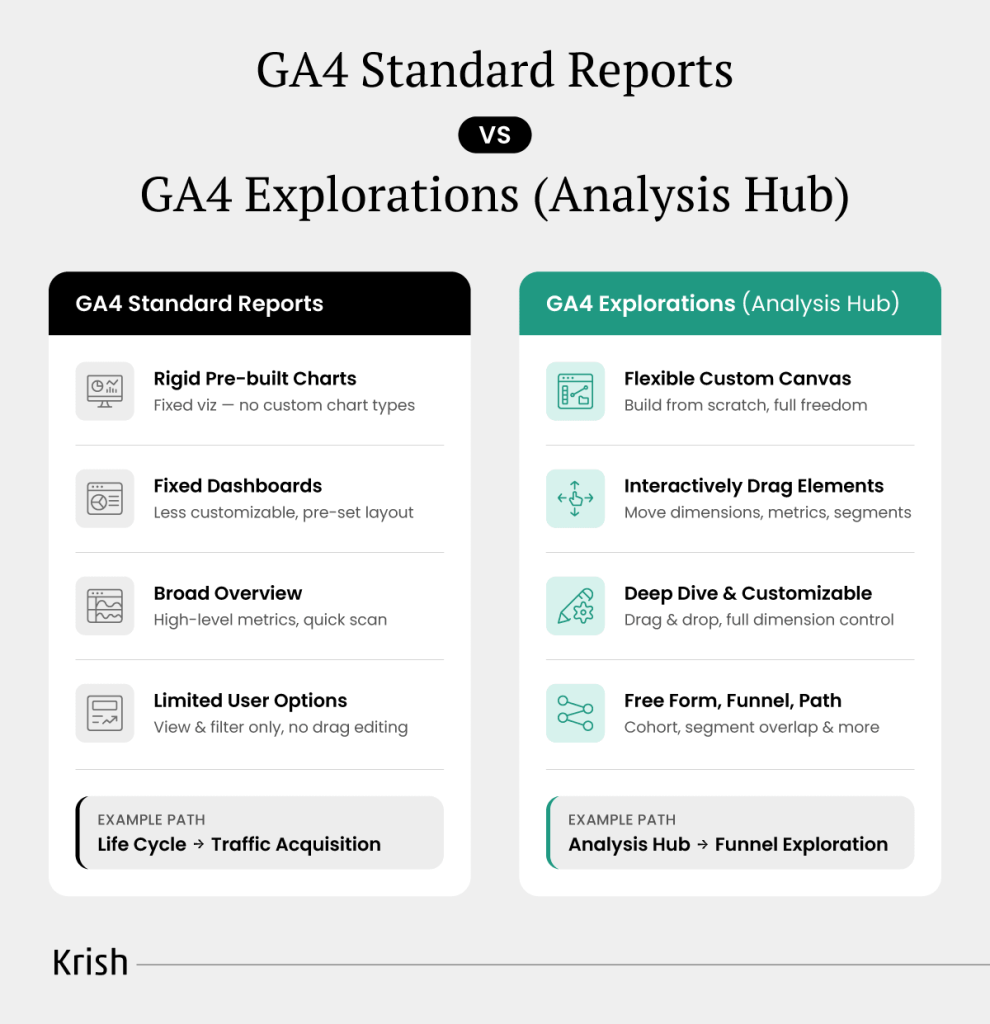
Standard Reports vs Explorations
Standard reports summarize performance. Explorations enable you to pose targeted queries on user activity and create custom funnels that align with your business model.
This flexibility is necessary to accurately track conversion drop-offs in GA4.
Open vs Closed Funnels
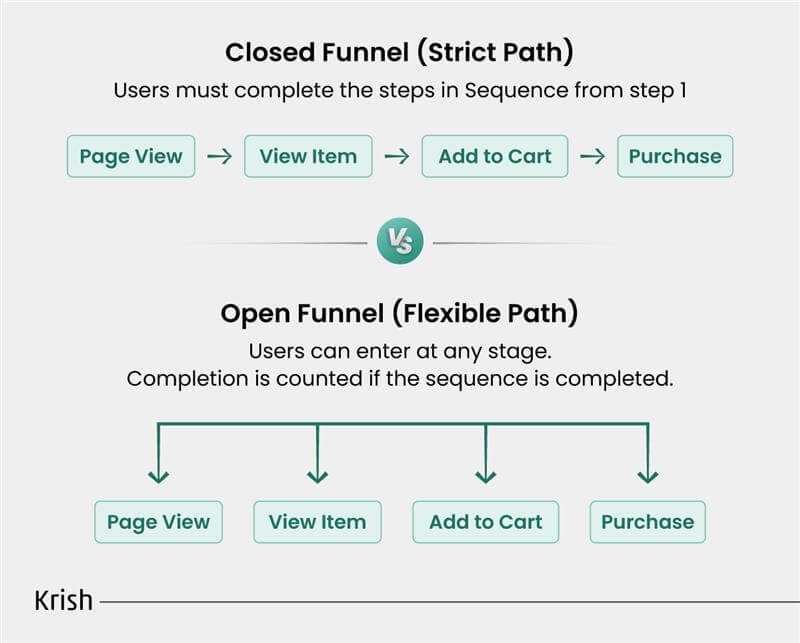
- Closed funnels track users entering from the first step only, ideal for structured journeys like checkout
- Open funnels include users entering at any stage, useful for broader behavioral analysis
Metrics That Matter
- Step completion rate highlights progression efficiency
- Drop-off rate identifies friction concentration
- Time to convert distinguishes hesitation from intent
These metrics should be interpreted together. A high drop-off with low time-to-convert signals friction; high time suggests indecision.
Further Reading
Conversion Funnel Analysis: How to Identify and Fix Drop-Offs
Your funnel is leaking revenue at every stage you haven't analyzed yet. This guide shows you how to run a conversion funnel analysis, spot exactly where visitors drop off, and apply targeted fixes that move the needle.
Read the full blog →Step-by-Step: Tracking eCommerce Funnel Drop-Offs in GA4
This is where most GA4 implementations fail, not due to lack of data collection, but due to lack of precision. Each step below directly impacts the quality of your analysis.
Step 1: Define Your Funnel Strategy Before GA4
Before opening GA4, define what your funnel should represent.
Avoid copying a generic funnel. Instead, align it with your business model:
- Are users browsing multiple products before purchase?
- Is checkout multi-step or single-page?
- Do returning users behave differently from new users?
A weak funnel definition leads to misleading insights. Strong GA4 funnel analysis starts with business clarity, not tool configuration.
Step 2: Ensure Correct eCommerce Event Tracking
Your funnel is built on events. If events are inconsistent, your analysis will be flawed.
At a minimum, validate these events:
- view_item → product page visits
- add_to_cart → intent signal
- begin_checkout → transition to conversion
- purchase → final outcome
Also check:
- Are events firing across all devices?
- Are values (price, currency) being passed correctly?
- Are duplicate events being triggered?
This is a common failure point in eCommerce funnel drop-off analysis using GA4.
Step 3: Validate Data Before Building the Funnel
Do not jump directly into Funnel Exploration.
Use DebugView and real-time reports to confirm:
- Event sequence is correct
- No missing steps in user journeys
- Data consistency across sessions
If validation is skipped, drop-off rates become unreliable, and optimization decisions become risky.
Step 4: Create Funnel Exploration in GA4
Go to Explore → Funnel Exploration.
In this step, the majority of teams will recreate the basic funnel. This time, think about the funnel’s structure:
- Use meaningful step names (not just event names)
- Align steps with user intent, not just actions
- Avoid overloading the funnel with unnecessary steps
This improves the interpretability of your Google Analytics 4 funnel analysis.
Step 5: Define Funnel Steps with Precision
Carefully map out each of these stages:
- Step 1: Product View (view_item)
- Step 2: Add to Cart (add_to_cart)
- Step 3: Checkout Start (begin_checkout)
- Step 4: Purchase (purchase)
Additional steps to consider:
- Cart view versus add to cart
- Shipping, billing, and payment within checkout
The clearer you are in explaining each step, the more your data can tell you about where users are leaving.
Step 6: Configure Funnel Type and Conditions
Choose funnel type based on your objective:
- Closed funnel: For strict checkout analysis
- Open funnel: For broader behavioral understanding
Then layer conditions:
- Device category (mobile vs desktop)
- Traffic source (paid vs organic)
- User type (new vs returning)
This is where tracking conversion drop-offs in GA4, as well as GA4 Audit service from an expert, can prove to be strategically useful because drop-offs are rarely the same for everyone.
Step 7: Analyze Drop-Off Patterns, Not Just Numbers
Most teams stop at identifying the highest drop-off stage. That is insufficient.
Instead, analyze:
- Where is the sharpest decline between steps?
- Which segment shows abnormal behavior?
- Is the drop-off consistent over time, or does it vary?
High mobile abandonment rates at checkout and the absence of this pattern on desktop could indicate mobile UX issues; this is what advanced GA4 funnel analysis reveals.
Studies show that mobile users show significantly higher drop-off rates, often exceeding 75%, making device-level funnel analysis essential.
Step 8: Quantify Business Impact of Drop-Offs
Translate drop-offs into revenue terms:
- How many users drop at each stage?
- What is the average order value?
- What revenue is being lost per step?
This shifts the conversation from “conversion rates” to “recoverable revenue.”
For additional perspectives on conversion improvement, read our detailed guide about Five Important Tips that Improve your Online Conversion Rates.
Step 9: Prioritize Fixes Based on Impact
Not all drop-offs deserve equal attention.
Prioritize based on:
- Revenue impact
- Ease of implementation
- Frequency of occurrence
For example:
- Fixing checkout friction may deliver faster ROI than optimizing product pages
- Addressing mobile issues may unlock larger gains than desktop improvements
Step 10: Continuously Monitor and Iterate
Funnel analysis is not a one-time setup.
User behavior evolves. Product catalogs change. Traffic sources shift.
Your funnel analysis must evolve accordingly.
Further Reading
GA4 Custom Dimensions vs Event Parameters: When Do You Actually Need Them?
Most GA4 users collect event parameters but never unlock their full reporting power. This guide breaks down the real difference between custom dimensions and event parameters — and exactly when to use each for smarter analytics.
Read the full blog →How to Reduce Funnel Drop-Offs?
For structured optimization, opt for CRO audit services to gain insights.
You can also read our detailed article on CRO audits, what they analyze, the patterns they reveal, and why traffic alone doesn’t boost revenue.
Conclusion: Identify Drop-Offs to Boost Your Store’s Conversions
The drop-offs in an eCommerce funnel are not random; they point to issues in the customer experience. Proper analysis can identify where the customer experience goes wrong. GA4 funnel analysis can identify these trends, but the true power comes in acting on the data. Businesses can optimize their conversion paths to be more efficient and increase revenue growth without increasing acquisition costs if they recognize funnel analysis as a discipline.
This approach eventually shifts analytics from a reporting discipline to a growth discipline. Even a 1% improvement in conversion rate can drive significant revenue growth.
At Krish, we work hand-in-hand with eCommerce teams to drive measurable outcomes from insights gained on the funnel, be it uncovering unseen drop-offs, optimizing checkout, or developing a structured CRO roadmap. Through a combination of analytics, CRO and A/B testing services, we keep our sights fixed on a single goal: to help businesses realize more of the demand they already have.
Table of Content
Subscribe with Us!
Never miss any post, stay tuned!
Minal Joshi is a content marketer at Krish with a flair for eCommerce and Digital Commerce aspects. She is a MarTech fanatic with a knack of writing with which, she helps brands to curate, create, & commence digital brand positioning. Sharing insights via articles, case studies, eBooks, Infographics, and other forms of content creation is what she lives for. Being an ardent traveler, when not writing, you'll find her sipping coffee into the mountains or petting a stray.
Recommended Reading:
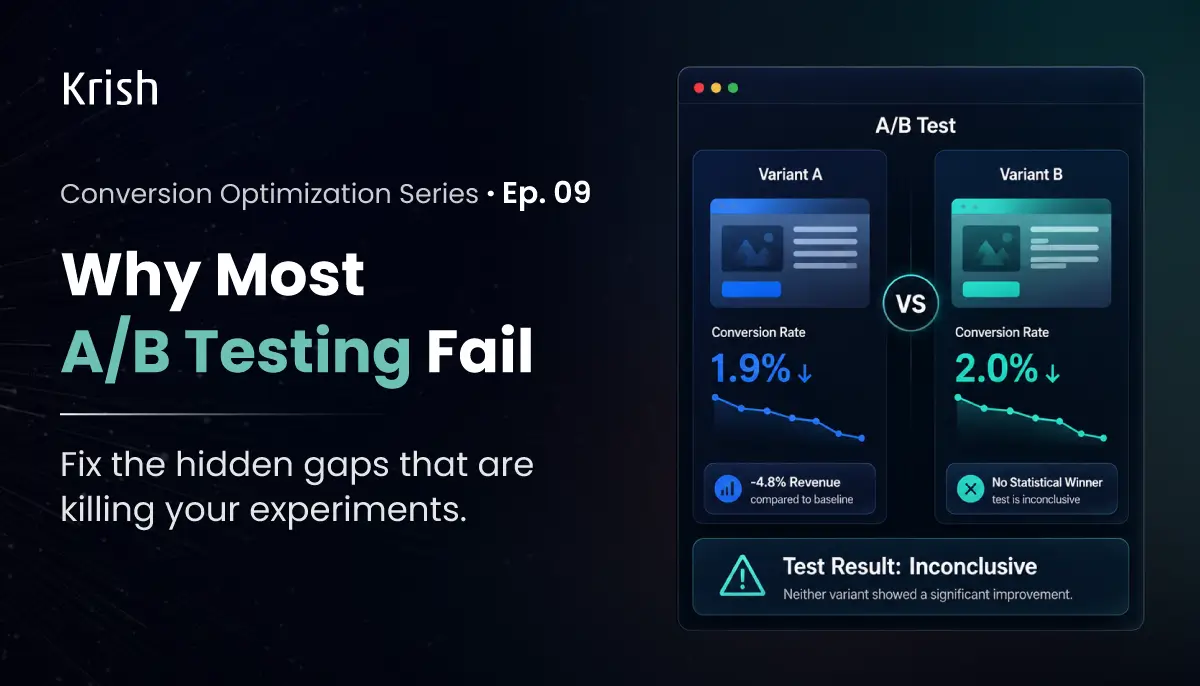
Why Most A/B Testing Programs Fail – Conversion Maturity Series | EP 09
22 July, 2026 In 2007, President Obama’s campaign's analytics lead, Dan Siroker, was certain that a video of the candidate would beat a plain photo on the sign-up page. He tested it anyway. Every video lost to every image. The winning combination, a family photo paired with a button that read "Learn More," lifted sign-ups from 8.26% to 11.6%. That 40.6% jump was later tied to roughly 2.9 million extra email addresses and about $60 million in donations, as Siroker documented for Optimizely. The expert was wrong, and only a disciplined test caught it.
Subscribe with Us!
Never miss any post, stay tuned!
Trusted by leading brands


