Friction never announces itself
Friction never sends you an invoice. It just costs unannounced.
No visitor thinks “this experience has too much friction.” They just leave. No complaint filed. No reason given. Just another exit your analytics logs without explanation.
That invisibility is what makes friction so expensive. It doesn’t show up as a line item. It doesn’t trigger an alert. It bleeds revenue in increments small enough to dismiss individually and large enough to matter enormously in aggregate.
According to Baymard Institute, the average cart abandonment rate is 70.22%, calculated across 50 studies. More critically, Baymard estimates that large ecommerce sites can achieve a 35.26% increase in conversion rate through better checkout design alone, representing hundreds of billions in recoverable revenue.
You’ve mapped your funnel in Issue 01. You’ve defined what converts in Issue 02. You’ve learned to observe behavior in Issue 03. Now meet the thing quietly undoing all of it.
Because the visitors were there, the intent existed, but the friction failed them.
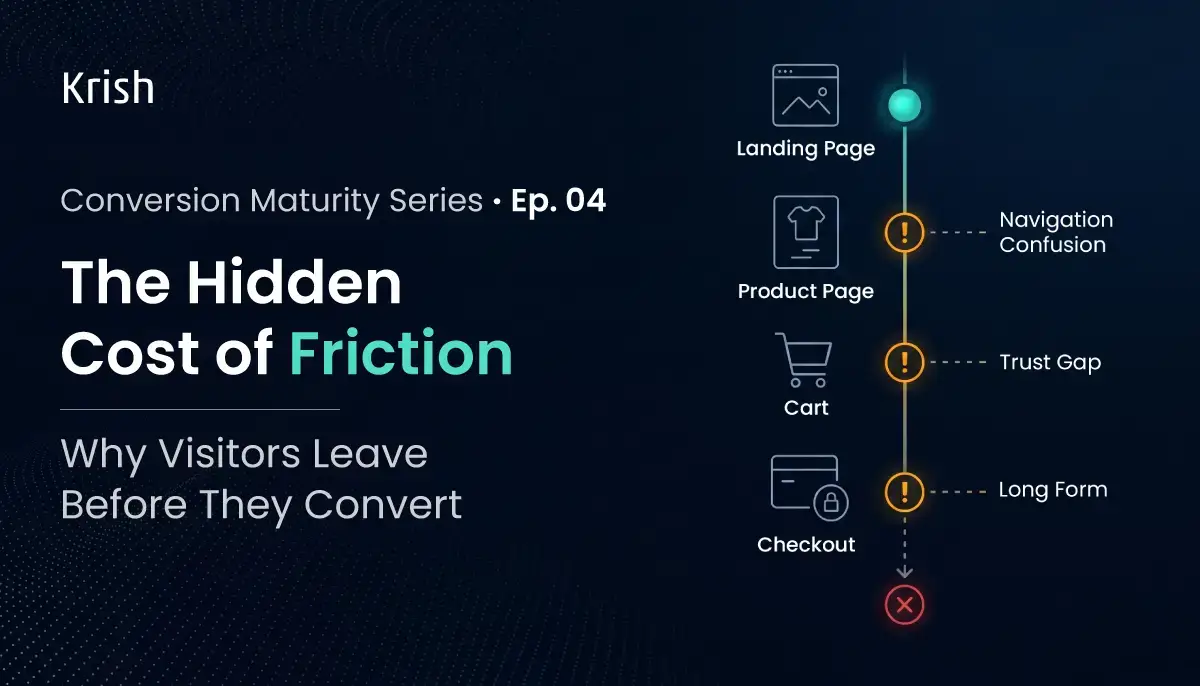
The six types of friction draining your funnel
The most expensive mistake in CRO is fixing friction events one at a time while ignoring their sequence. A visitor who absorbs three small resistances in a row behaves differently from one who hits a single large obstacle. The compound drop-off is not additive. It’s multiplicative.
The diagram below doesn’t show friction types in isolation. It shows how they stack across a single visitor’s journey.
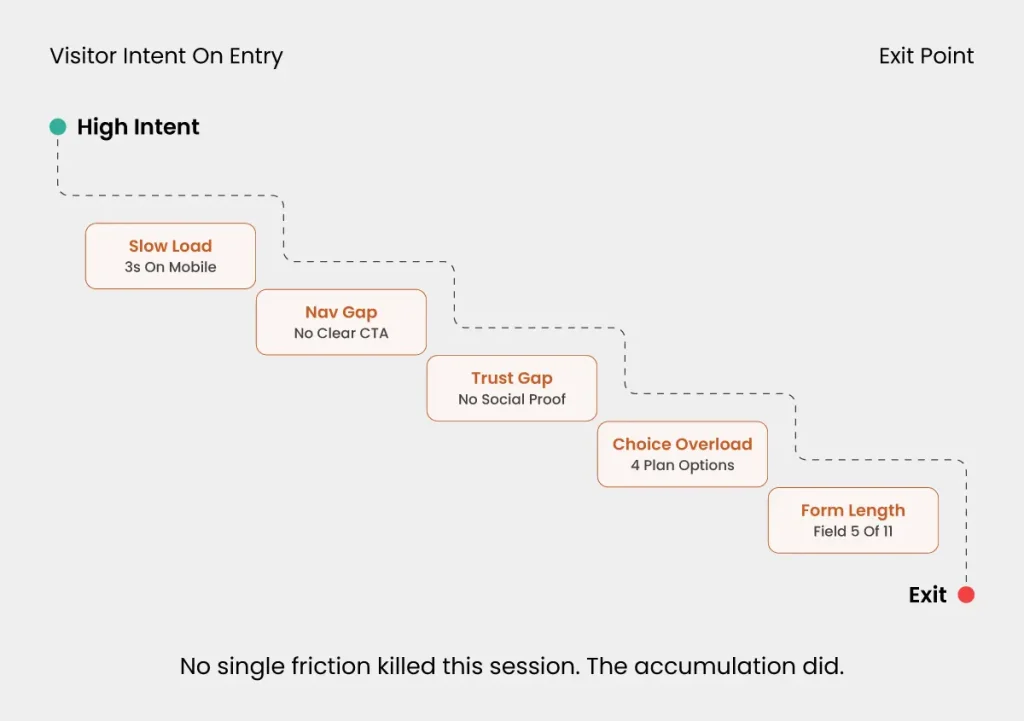
That visitor never reached checkout. Your cart abandonment report didn’t capture them. Your form analytics didn’t log them. They disappeared into the 70% that never converted, indistinguishable from everyone who was just browsing.
The 6 types and what each one actually does to a human.
This is not a taxonomy for filing. It’s a diagnostic lens for finding which ones live in your funnel right now.
1. Slow pages stop journeys before they begin.
According to Google’s Think With Google research on page speed, as page load time increases from one second to three seconds, the probability of a bounce increases by 32%. At five seconds, that probability reaches 90%. These visitors never saw your offer. Friction hit before the first impression.
2. Navigation confusion is a failure of assumed context.
A visitor arriving from a paid ad about a specific product lands on a page designed for visitors who know your brand. The journey assumes knowledge they don’t have. They look for a next step. They find four. None feel right. They leave. Your landing page looked fine in testing. It failed in market.
3. Weak trust signals are a doubt problem, not a design problem.
Security badges, recognizable payment logos, real customer reviews with verifiable specificity, clear refund terms: each one reduces the perceived risk of converting. Remove them and doubt fills the gap. A visitor who wants to buy but can’t confirm your legitimacy will not buy. They will go find a competitor whose site answers the question “is this safe?”
4. Poor mobile UX is the most structurally common failure.
Mobile sessions are the majority of traffic for most consumer-facing properties. Mobile conversion rates remain a fraction of desktop. The gap is not intent. It is execution: tap targets built for cursors, checkout flows that assume a keyboard, images and scripts that overwhelm cellular bandwidth. The visitor has intent. The interface assumes they don’t.
5. Choice overload is the friction nobody builds deliberately.
Four pricing tiers. Eight product variants with no clear recommendation. A checkout offering six payment methods before the visitor has confirmed their order. The paradox of choice is well-documented: beyond a certain point, more options reduce decision-making. The visitor who can’t choose, doesn’t. They postpone. Postponement, in digital, means exit.
6. Form length is the most measurable friction of all.
Baymard Institute’s checkout form research shows the average ecommerce checkout contains 11.3 form fields while most sites only need 8 to complete a transaction. Every unnecessary field is a small withdrawal from a visitor’s patience account. The account has a balance. When it runs out, they’re gone.
Friction has a specific ROI calculation
Here’s what makes friction remediation the highest-leverage investment in most CRO programs: it requires no new traffic, no new product, no new campaign. It repairs the value you already paid for.
The calculation is not about abstract conversion rate improvement. It is about cost-per-acquisition.
If your current CAC is $200 and a friction remediation program meaningfully increases the conversion rate on existing traffic, your CAC drops in direct proportion. The traffic cost stays flat. Revenue climbs. Margin improves.
This is why mature digital teams stop framing CRO as a “UX improvement” and start framing it as a margin discipline. The Krish conversion rate optimization practice approaches every engagement this way: friction is not an aesthetic problem. It is a commercial one. And unlike paid acquisition, fixing it doesn’t require ongoing spend to sustain the result.
A funnel drop-off analysis that maps the entire journey, not individual pages in isolation, surfaces friction that page-level audits miss. And why a CRO audit that combines quantitative drop-off data with behavioral observation, as covered in Issue 03, produces interventions that actually move revenue rather than just improving individual page metrics.
Fixing friction is not a design project. It is a revenue recovery program.
Three checks to run on your funnel this week
- Load your highest-traffic product or service page on a mobile device on cellular. If it takes more than three seconds to become usable, you have a confirmed, Google-verified conversion cost operating right now.
- Count the form fields on your primary lead capture or checkout form. For each one, ask: does completing this transaction require this field, or does our CRM want it? Every field in the second category is a friction point with a measurable abandonment cost.
- Open your pricing or product page. Count the CTAs visible without scrolling. More than two means your visitor has a decision to make before they can make the decision you want them to make.
The answers to these three checks will tell you more about your conversion problem than most analytics reports.
Friction remediation does not require a platform migration or a redesign. It requires knowing precisely where the resistance lives and what specifically to remove.
Issue 05 moves from friction to psychology. Understanding why visitors respond to specific signals, the cognitive shortcuts, the trust heuristics, the decision triggers that high-converting pages activate, is what separates teams that remove friction reactively from those who build for conversion from the first design decision. Stay tuned.
Table of Content
Subscribe with Us!
Never miss any post, stay tuned!
Mayank is a Digital transformation strategist passionate about helping global brands scale through transformative digital experiences. With deep expertise in customer-centric journeys, he partners with enterprises to align technology with business goals, driving value across the customer lifecycle, brand experience, and performance. Known for building authentic relationships, he uncovers meaningful growth opportunities through thoughtful collaboration. When he’s not crafting the next big move in digital strategy, you’ll likely find him at the snooker table, lining up his next perfect shot.
Recommended Reading:

Your Website Is Leaking Revenue: The CRO Audit Checklist – MarTech Masterclass Series Ep | 15
4 June, 2026 That is not a headline. That is the math. The average ecommerce conversion rate dropped to 1.70% in 2026, a 16% decline from 2023, according to IRP Commerce. Which means the overwhelming majority of the traffic you paid to acquire, nurtured through segmentation and orchestration across channels, is evaporating somewhere between landing and checkout.
Subscribe with Us!
Never miss any post, stay tuned!
Trusted by leading brands


