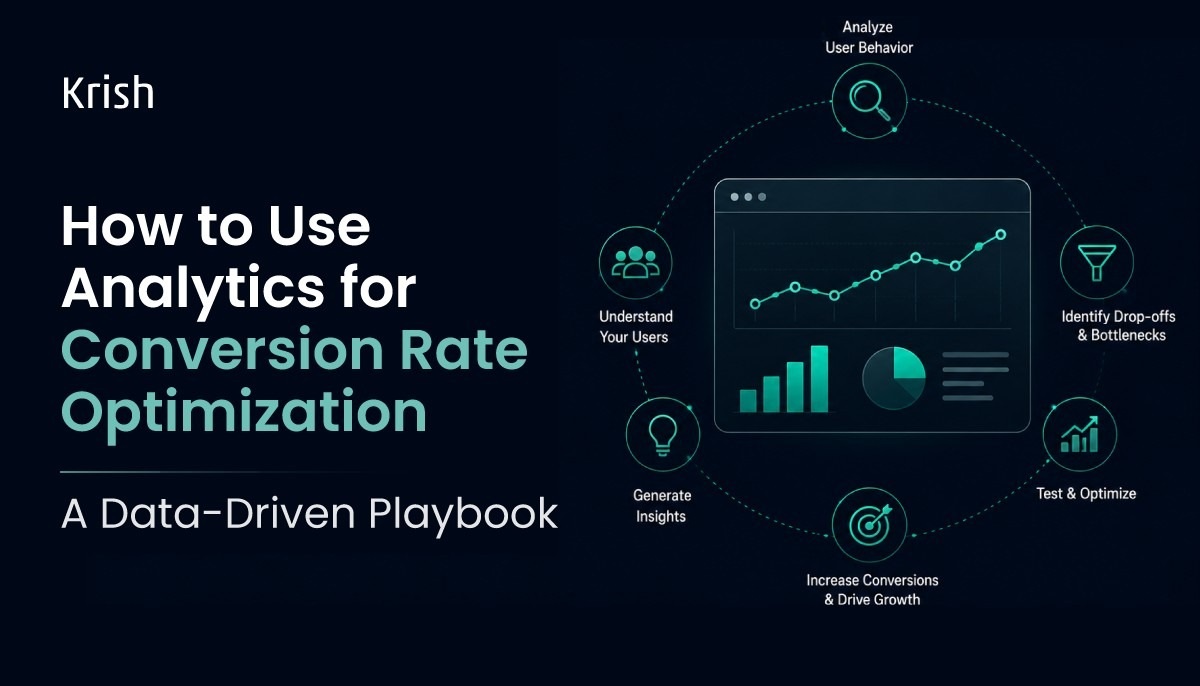
Introduction
Most eCommerce brands are drowning in data but starving for conversions because they obsess over what happened, rather than diagnosing why it happened. Staring at a declining conversion rate on a dashboard does not fix a broken checkout flow. Conversion rate optimization analytics is the process of using quantitative data (like GA4 metrics) and qualitative data (like user heatmaps) to identify friction points in a digital commerce journey and test targeted improvements.
Marketing operations leads cannot rely on gut feeling to scale revenue. Scaling requires a shift from passive reporting to active, hypothesis-driven testing. This playbook outlines exactly how to stop treating analytics platforms as static reporting tools and start using them as revenue-generating diagnostic engines.
Why traditional analytics dashboards fail modern eCommerce
Standard reporting tells a fraction of the story. A basic web dashboard might show a sudden spike in bounce rates on a flagship product page. That metric is entirely useless on its own. It cannot tell you if the page took too long to load, if the primary product image broke on mobile devices, or if the pricing confused the buyer.
The trap of descriptive metrics
Digital commerce leaders often rely on flawed, surface-level indicators. Looking closely at Gartner’s digital commerce metrics, research shows that a vast majority of analytics implementations fail to deliver measurable ROI precisely because they focus on historical reporting rather than predictive actions. Descriptive metrics—like average session duration or page views—give you a false sense of control. They track traffic, not intent.
If you are only looking at descriptive data, you are conducting an autopsy on lost sales. You know the customer left, but the exact mechanism of failure remains hidden.
Shifting to diagnostic and predictive data
Maturity in digital commerce requires moving up the analytics value chain. Krish utilizes a proprietary approach called the Krish Predictive Commerce Matrix, which categorizes data utilization into three phases: tracking, diagnosing, and predicting. Tracking captures the baseline. Diagnosing asks why a specific user segment abandons their cart at the shipping phase. Predicting leverages machine learning to anticipate drop-offs before they impact the bottom line.
Over the next 12 to 18 months, relying on static A/B testing will become a competitive disadvantage. AI-led predictive analytics will auto-identify funnel anomalies in real-time, allowing building an AI strategy for retail to become the baseline standard for enterprise digital commerce.
How do you analyze data for conversion rate optimization?
Effective conversion rate optimization analytics requires a structured, repeatable framework. Randomly testing button colors based on a blog post you read will not yield statistically significant growth. Here is the practitioner’s method to leverage digital analytics to shape up their ecommerce strategy.
Step 1: Map the macro and micro conversions
Every analysis must begin by defining success. A macro conversion is the ultimate commercial goal—typically a completed purchase or a signed B2B contract. Micro conversions are the sequential steps a user takes to reach that goal. These include adding an item to a cart, engaging with a sizing chart, or signing up for a newsletter. You cannot optimize a macro conversion without isolating the specific micro conversion where users lose momentum.
Step 2: Identify funnel drop-offs in GA4
Google Analytics 4 requires deliberate configuration to be useful for CRO. Navigate directly to the Monetization reports, specifically the Ecommerce purchases section. Create custom Funnel Explorations that map the exact steps of your checkout. You are looking for the largest percentage gap between two sequential steps. If 80% of users drop off between viewing the cart and entering their payment details, you have identified the primary leak. Isolating these exact friction points is the foundation of conversion rate optimization best practices.
Further Reading
How to Track Funnel Drop-Offs in GA4: Step-by-Step Guide for Ecommerce
Predictive churn models detect disengagement signals before customers go dark. But you first need to know where users are dropping off. This GA4 guide walks through how to build that visibility into your funnel — step by step.
Read the full blog →Step 3: Layer in qualitative user behavior
Numbers highlight the location of the problem. Qualitative data explains the cause. When a leading global apparel brand noticed a 40% checkout drop-off in GA4, they integrated qualitative heatmapping data via Hotjar. Session recordings revealed that mobile users could not easily find the promotional code box, causing them to abandon the purchase to search Google for coupons. Fixing the UI hierarchy recovered millions in lost revenue. A similar approach can be used to improve your Magento cart conversion rates.
Further Reading
8 Simple Ways to Improve UX for eCommerce Websites
Heatmaps and session recordings help uncover where shoppers struggle, but lasting conversion gains come from fixing the underlying experience. Learn actionable UX strategies that improve usability, build customer confidence, and create smoother paths to purchase.
Read the full blog →Step 4: Formulate data-backed A/B test hypotheses
Once you have quantitative proof of a drop-off and qualitative evidence of why it happens, you must prioritize what to fix. Implement the PIE framework: Potential (how much improvement can be made?), Importance (how valuable is this traffic?), and Ease (how complicated is the technical fix?). Formulate a strict hypothesis before writing a single line of code.
Want to know if your MarTech stack is ready for AI-driven insights?
CRO analytics: choosing the right platform
Selecting the right tooling determines the depth of your insights. No single platform does everything perfectly. Modern digital commerce architectures require a composable approach, blending tools that excel at specific functions to form a complete analytical picture.
Quantitative analytics platforms
Google Analytics 4 (GA4) GA4 is the industry standard for tracking quantitative user behavior and macro trends. It excels at event-based tracking and cross-device measurement. It is best suited for marketing operations teams who need to build custom funnel explorations and monitor overall traffic health. However, it lacks the visual context needed to truly understand user frustration.
Mixpanel Mixpanel provides granular, product-led analytics. It goes deeper into user retention and cohort analysis than out-of-the-box GA4. Mixpanel is best suited for complex, multi-step SaaS platforms or highly customized B2B commerce portals where tracking long-term user behavior patterns is critical.
Qualitative analytics platforms
Hotjar Hotjar captures the human element of digital commerce through heatmaps, scroll maps, and session recordings. It visualizes exactly where users click, pause, or rage-click in frustration. Hotjar is best suited for UX designers and CRO specialists who need to validate why a specific page element identified in GA4 is failing to convert users.
AI-Driven personalization platforms
Dynamic Yield Dynamic Yield shifts the focus from historical reporting to real-time predictive action. It uses machine learning algorithms to serve personalized content, product recommendations, and targeted offers based on user behavior in the moment. It is best suited for enterprise retailers looking to scale beyond manual A/B testing and automate their revenue optimization efforts.
Further Reading
Building an AI Strategy for Retail: Key Considerations
The future of conversion optimization goes beyond dashboards and manual testing. Discover how leading retailers are building AI-ready ecosystems that use predictive analytics, personalization, and intelligent automation to improve customer experiences and drive revenue growth.
Read the full blog →The reality of CRO analytics: caveats, timelines, and compliance
Technology platforms are not magic solutions. Injecting advanced analytics into a broken foundation will only help you measure your failure more accurately.
When data-driven CRO fails
Analytics-driven testing requires volume. If a specific product category only receives a few hundred visitors a month, running an A/B test is a waste of resources. You will never reach statistical significance. In low-traffic environments, qualitative user interviews and heuristic UX evaluations are far more valuable than quantitative testing. Similarly, legacy technical debt can ruin optimization efforts. If your platform’s inherent load time is six seconds, testing button copy will not save you.
A realistic implementation timeline
Expect a 60 to 90-day sprint to see initial commercial returns. The first two to four weeks require rigorous data collection, configuring custom GA4 events, and running session recordings to establish a baseline. The following four weeks are dedicated to deploying A/B tests and letting them run until they achieve at least 95% statistical significance. Rushing this timeline results in false positives.
Navigating privacy and data compliance
Data privacy legislation directly impacts how you collect CRO metrics. Relying heavily on client-side cookies is a failing strategy. According to digital privacy data from Statista, sweeping regulations are forcing brands to adapt. Complying with GDPR and CCPA requires implementing server-side tracking and explicit consent management platforms. Without these safeguards, you risk massive legal liabilities and the sudden loss of critical behavioral data.
Conclusion: The future of data-driven digital experiences
Digital commerce is rapidly abandoning static testing. In the next 12 to 18 months, the reliance on manual A/B tests will be replaced by continuous, AI-led personalization engines. These systems will autonomously ingest quantitative and qualitative data to redesign user experiences in real time, serving highly individualized checkout flows to essential tips to improve your mobile ecommerce conversion optimization. Preparing for this shift means ensuring your underlying data architecture is composable, clean, and capable of interacting with machine learning models today.
Data is only as valuable as the decisions you make with it. For over 20 years, Krish has engineered platform-agnostic, MACH-ready architectures that help enterprise brands turn raw analytics into revenue-generating experiences. Whether you need to fix a leaking checkout funnel or implement predictive personalization, our expert CRO and A/B testing strategy team builds the frameworks that convert traffic into loyal customers.
Frequently Asked Questions
Table of Content
Subscribe with Us!
Never miss any post, stay tuned!
Minal Joshi is a content marketer at Krish with a flair for eCommerce and Digital Commerce aspects. She is a MarTech fanatic with a knack of writing with which, she helps brands to curate, create, & commence digital brand positioning. Sharing insights via articles, case studies, eBooks, Infographics, and other forms of content creation is what she lives for. Being an ardent traveler, when not writing, you'll find her sipping coffee into the mountains or petting a stray.
Recommended Reading:
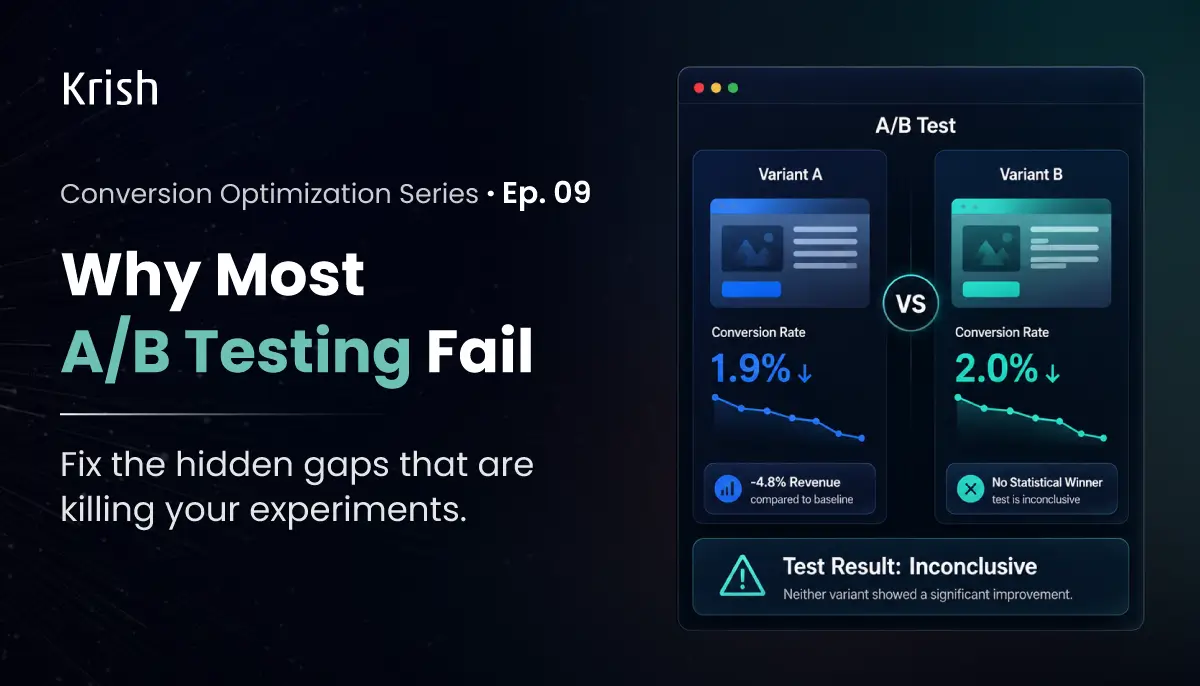
Why Most A/B Testing Programs Fail – Conversion Maturity Series | EP 09
22 July, 2026 In 2007, President Obama’s campaign's analytics lead, Dan Siroker, was certain that a video of the candidate would beat a plain photo on the sign-up page. He tested it anyway. Every video lost to every image. The winning combination, a family photo paired with a button that read "Learn More," lifted sign-ups from 8.26% to 11.6%. That 40.6% jump was later tied to roughly 2.9 million extra email addresses and about $60 million in donations, as Siroker documented for Optimizely. The expert was wrong, and only a disciplined test caught it.
Subscribe with Us!
Never miss any post, stay tuned!
Trusted by leading brands


