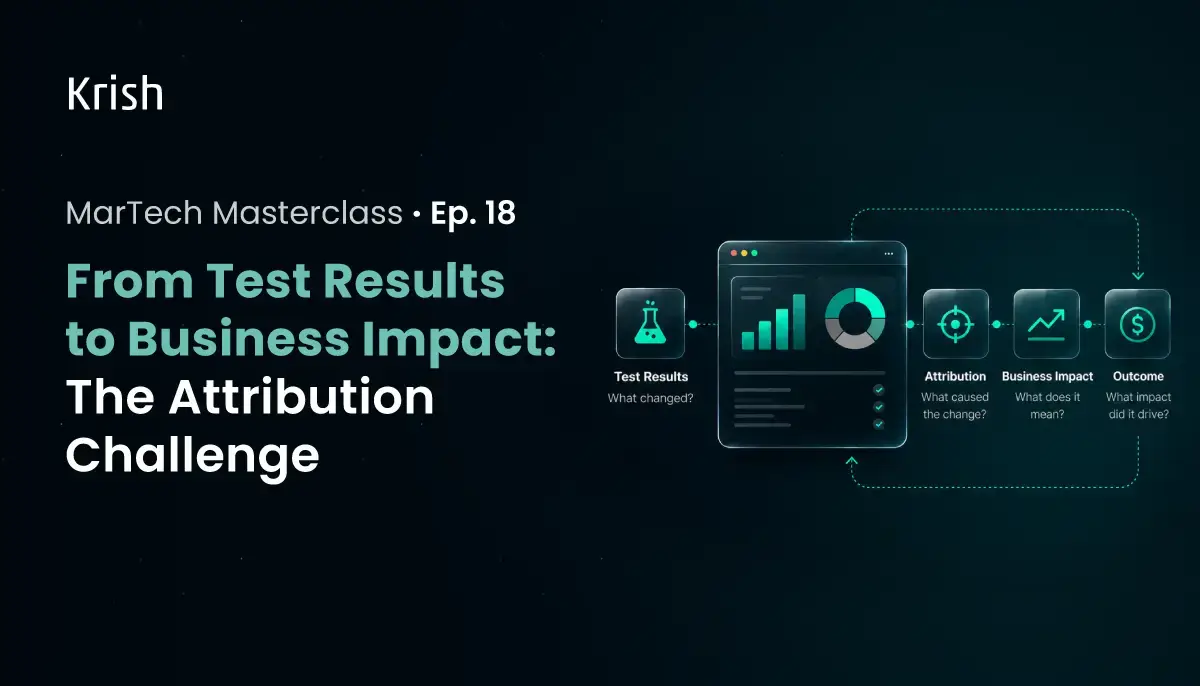
When a Win on the Dashboard Is Not a Win for the Business
A variant reaches statistical significance. The team celebrates, ships the winner, and moves on to the next experiment. Weeks later, the metrics leadership actually tracks have not moved. Revenue per session is flat. The number the finance team questions every quarter shows no change that can be credited to the test. The experiment was run correctly. The result was real. And somehow, nothing changed.
This is the attribution challenge in experimentation, and it is not a measurement technicality. It is the gap that kills experimentation programs. Teams become fluent in the language of testing: p-values, confidence intervals, relative lift. They rarely develop equal fluency in the language of business impact, where results either show up in a financial statement or they do not.
That gap between the two vocabularies is where executive confidence quietly erodes, regardless of how disciplined the testing practice looks from the inside.
Everything in this series has been building toward this point. From the GA4 configuration decisions that determine whether behavioral data is trustworthy to the segmentation and prioritization frameworks in episode 17 that determine which tests run first, the entire stack exists to produce decisions that are worth making and results that are worth trusting. This episode covers what it takes to make sure a test result actually earns that trust.
What Statistical Significance Actually Means
Before any of the common misinterpretations can be addressed, the term itself needs to be precise.
A test that reaches 95% statistical significance means one specific thing: there is a 5% probability that the observed difference between the control and the variant occurred by random chance, assuming no real underlying difference exists. That is the complete claim. It does not mean:
- There is a 95% probability that the variant is genuinely better
- The lift is large enough to matter in revenue terms
- The result will hold at full rollout across all visitor types and all weeks of the year
- The metric that moved is the metric the business cares about
Statistical significance is a statement about probability under a controlled model. It tells you the result is probably not noise. It says nothing about whether the result is worth acting on.
The Errors That Turn False Signals Into Shipped Decisions
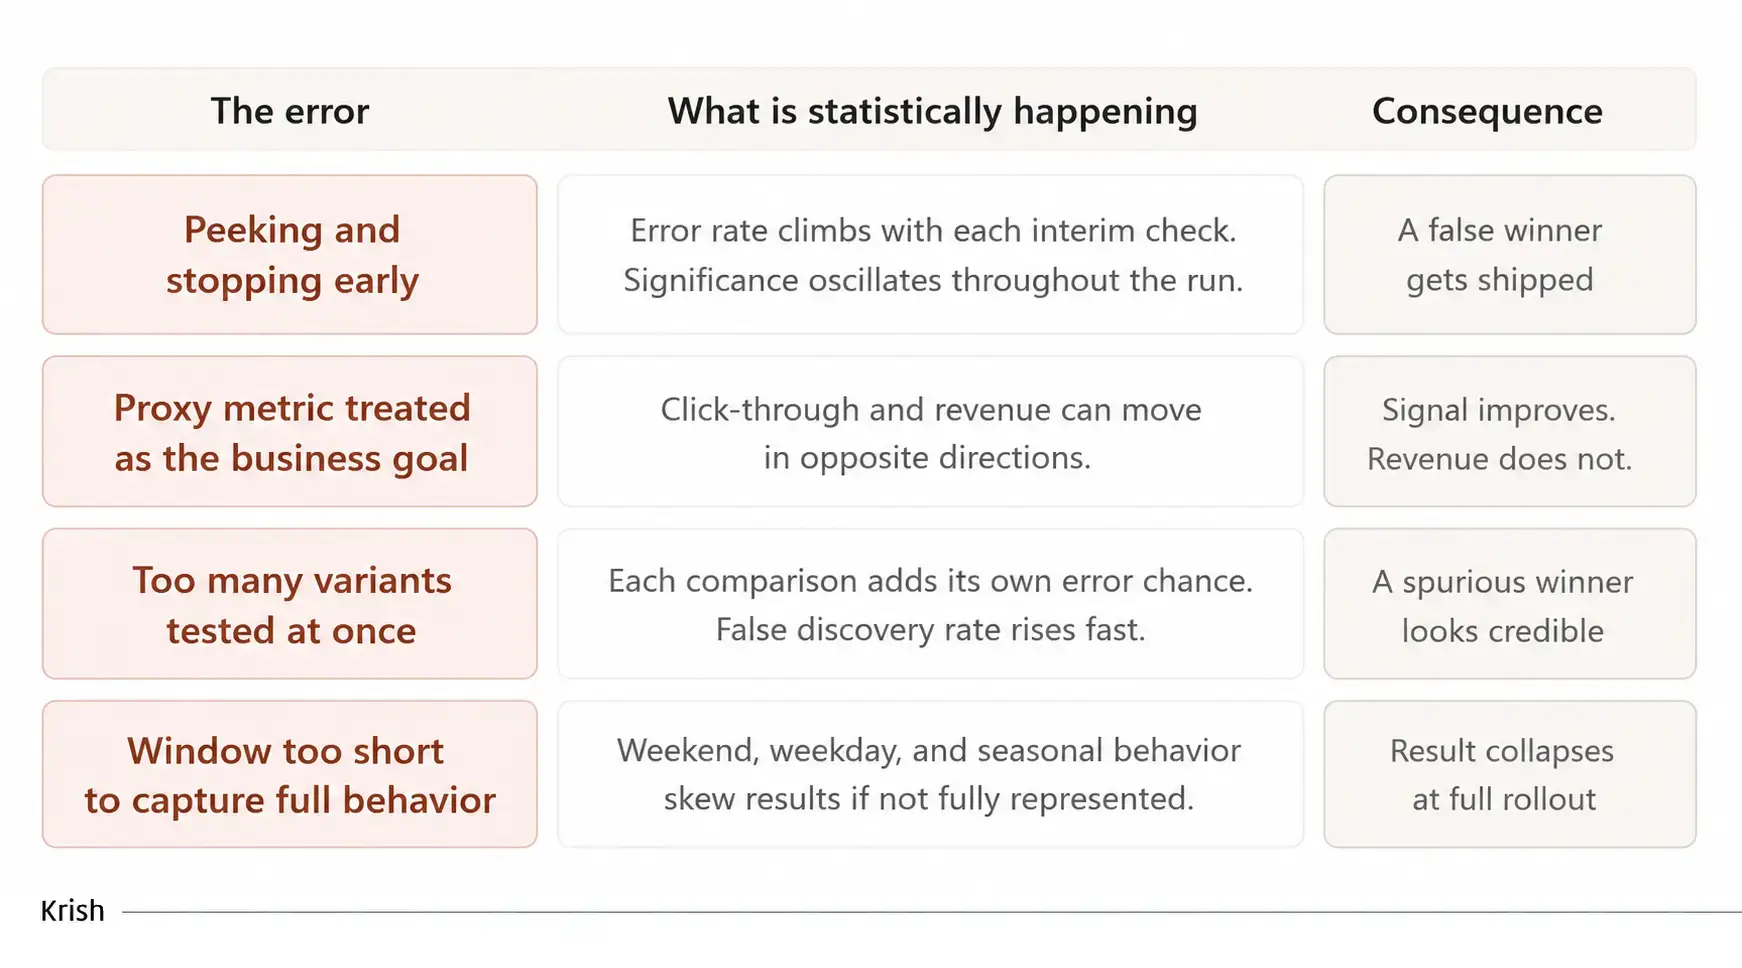
Peeking and stopping early
This is the most widespread error, and it persists because it feels like diligence rather than a mistake. Someone checks the results dashboard partway through the test, sees that significance has been reached, and calls it.
Optimizely, which developed Stats Engine in collaboration with Stanford statisticians, ran simulations of millions of A/A tests, which are tests where both variants are identical and no real difference exists. They found that more than 57% of those tests falsely declared a winner or loser at least once during their course, even if only briefly. Continuous monitoring, checking after every visitor, can push the error rate from a target of 5% all the way past 25%.
The significance of reading is real. The underlying winner is not. And the team that ships on that reading has shipped a decision built on noise.
The only fix is categorical: determine sample size and end date before the test starts, and do not act on the result until that date is reached, regardless of what the dashboard shows along the way.
Treating a proxy metric as though it were the business goal
A lift in click-through rate (CTR) on a product page call to action can look like unambiguous success. But CTR and revenue are not the same thing. A variant can attract a larger volume of lower-intent clicks while simultaneously reducing the rate at which those clicks complete a purchase. The team that only watches the metric closest to the change being tested can improve the signal while making the underlying business outcome worse without ever realizing it, because the downstream metric was never part of the test design.
Every experiment needs two explicitly named metrics before it launches: the primary test metric, which measures the direct effect of the change, and the business metric, which measures what the company actually cares about. If those two move in opposite directions, the result is not a win by any definition that matters to leadership.
Running too many variants simultaneously
The same Optimizely’s documentation on false discovery rate control describes the core problem directly: when an experiment runs with more than one variation or more than one metric, these are collectively multiple hypotheses, and performing several hypothesis tests simultaneously increases the probability of making an error by basing a critical business decision on a false positive, and that probability rises rapidly with the number of hypothesis tests running at the same time.
The platform addresses this with false discovery rate control, but the underlying principle applies regardless of which tool a team uses: more variants mean more chances for a spurious result to look significant.
Running the test for too short a window
A test that never spans two full business cycles captures a distorted picture of visitor behavior. Weekday and weekend purchase patterns differ. Promotional periods attract a different visitor mix than baseline weeks. A short window may capture only one of these patterns, and the result it produces will not hold at full rollout because the audience composition driving the result is not representative of the year-round visitor mix.
How to Connect a Test Result to Business Impact
Statistical significance is the entry requirement for taking a result seriously. It is not sufficient on its own to justify a business decision. Connecting the two requires a deliberate measurement sequence, not just a dashboard check.
1. Name both metrics before the test launches.
Every experiment should explicitly name the primary test metric and the business metric, and commit to tracking both. If a team cannot name the mechanism by which the test metric connects to the business metric, the hypothesis is not ready to run. This is not a bureaucratic standard; it is the discipline that prevents proxy metric wins from being counted as business wins.
2. Run a confirmation holdout before full rollout.
Optimizely’s false discovery rate documentation includes an instructive example: in a scenario where nine of ten comparisons are inconclusive and only two register as conclusive, but one of those two is a false winner, the proportion of false discoveries among the implemented results is 50%, one out of two. A holdout addresses this by releasing the winning variant to the majority of traffic while keeping a smaller portion on the control, and measuring the business metric across both groups for an additional period before committing to the permanent change. It catches the failure mode where a result that held during the test does not hold under sustained real-world traffic.
3. Track downstream metrics for several weeks after shipping
The test window is not the measurement window. A change that improves checkout initiation can occasionally suppress average order value if it attracts a less confident buyer. A change that increases add-to-cart activity can raise return rates if it reduces purchase certainty. These downstream effects do not appear inside the original test window. They only become visible when business metrics are watched continuously after the team has already moved on to the next experiment.
4. Express the result in revenue language, not percentage language
A statistically significant improvement in checkout completion rate means something to the testing team and very little to the finance team. The same result expressed as incremental completed orders per month against average order value means something to both. This translation is not optional if the goal is sustained executive funding. Leadership evaluates every investment in revenue terms. Experimentation programs that cannot speak that language do not stay funded.
Multivariate Testing: A Precise Tool for a Precise Question
Multivariate testing (MVT) tends to enter a program for the wrong reason: efficiency. Instead of running sequential A/B tests on a page, a team runs one MVT that examines multiple elements at once and finds the strongest combination. The appeal is real. The math behind it frequently is not.
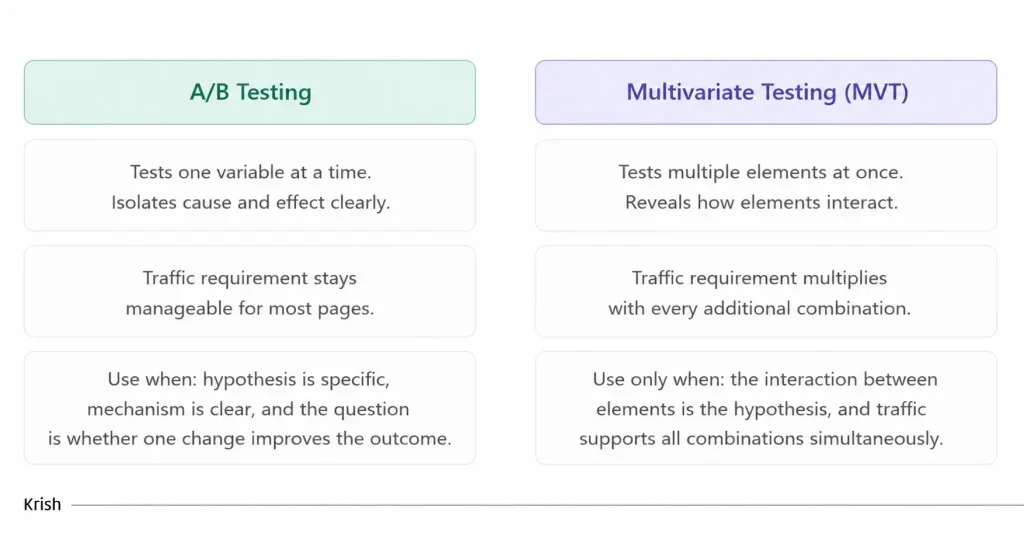
The traffic required to reach a reliable result in an MVT scales with the number of combinations being compared, not simply the number of elements. Two elements with two variants each produce four combinations. Three elements with two variants each produce eight. Each combination needs the same minimum sample size as a standalone A/B test.
A page that reaches statistical significance in four weeks of A/B testing may need three or four times that duration for a three-element MVT on the same traffic, by which point the program has consumed a quarter of testing capacity on one experiment.
The condition under which MVT earns its place is specific: when the hypothesis is about the interaction between elements, not the effect of each element independently. If a team wants to know whether a particular headline performs differently depending on which image accompanies it, and there is a clear mechanism for why those two elements would interact, that is an MVT question. If the team wants to know whether a new headline outperforms the current one, that is an A/B question, and running MVT to answer it is using a more expensive and slower instrument for a job that did not require it.
The default for any program that is not operating at very high page-level traffic volumes is sequential A/B testing with one clearly isolated hypothesis per test. MVT earns its place after a program has already run enough sequential experiments on a page to understand which individual elements matter, and then has a specific reason to believe two of them interact.
Building a Test Knowledge Base That Prevents Redundant Experiments
Here is a waste that compounds invisibly over time in almost every experimentation program:
A test runs, the result is recorded in the testing platform, and 6 months later, someone proposes a closely related experiment under a different framing. Nobody remembers the prior result. The test runs again, and the program spends testing capacity to learn something it already knew.
It is an institutional memory failure, and it grows more expensive as the program matures and accumulates more history that nobody can search through reliably.
A test knowledge base is not the same thing as the results table inside a testing platform. The platform stores outcomes. The knowledge base stores understanding, written so that someone who was not part of the original test can use what was learned to inform a new one.
What each entry contains:
- The original hypothesis in plain language: what behavior was observed, what change was proposed, what outcome was expected
- The primary metric and audience segment that were tested
- The result: win, loss, or inconclusive, with the actual observed movement, not a percentage in isolation
- The business metric outcome: did revenue per session, completed purchases, or average order value move in the direction the test predicted?
- The learning statement: one or two sentences that translate the result into something transferable about how users on this specific site behave in this specific context
The learning statement is the piece most programs skip. They record that a test won or lost without recording what that result implies about the user behavior it revealed. A test that shows visitors scrolling past a call to action to find returns policy information, and produces a meaningful lift when that information is placed adjacent to the call to action, is not only a win on that page. It is evidence of an anxiety pattern that likely exists on every page in the funnel where a commitment action is present. That inference belongs in the knowledge base, connected to the result that generated it.
This knowledge base should be consulted before any hypothesis enters the ICE scoring process from episode 17. If a related test has already run, that prior result becomes the Confidence evidence for the new hypothesis, or the reason not to run it at all. A hypothesis that directly contradicts a prior finding needs a strong mechanistic explanation for why it might produce a different result, or it needs a higher evidence standard before consuming a test slot.
The knowledge base also protects against the institutional memory problem that hidden data gaps create across the wider analytics stack. When the two or three people who were present for the original test move on, the learning goes with them. A documented knowledge base keeps that learning in the organization regardless of who leaves.
Finally: The Program That Learns Faster Than the Competition
The experimentation programs that build durable commercial advantage are not the ones with the highest test volume. They are the ones that extract the most understanding from each test and use that understanding to make the next hypothesis sharper, the next metric selection more precise, and the next result more directly connected to a number that shows up in the business.
Statistical significance is the entry requirement. A confirmed business metric movement is the standard for acting on a result. A structured knowledge base is the compound asset that makes the program improve its own output over time. Together, these disciplines are what Krish builds CRO and A/B testing programs around: not just the test infrastructure, but the measurement rigor and institutional learning that make test results worth acting on.
The GA4 configuration that produces trustworthy behavioral data. The funnel tracking that makes Impact scoring honest. The hidden data gap discipline that stops corrupted inputs from reaching downstream decisions. Every layer of the MarTech stack this series has covered either strengthens or weakens what the experimentation program can learn and how quickly it can act on what it learns.
That is what the series has been building toward: not a collection of tools and frameworks, but a connected operating model where each capability reinforces the next, and where the measurement of results feeds back into the design of future experiments with enough precision to produce outcomes that leadership will fund again.
Table of Content
- When a Win on the Dashboard Is Not a Win for the Business
- What Statistical Significance Actually Means
- The Errors That Turn False Signals Into Shipped Decisions
- How to Connect a Test Result to Business Impact
- Multivariate Testing: A Precise Tool for a Precise Question
- Building a Test Knowledge Base That Prevents Redundant Experiments
- Finally: The Program That Learns Faster Than the Competition
Subscribe with Us!
Never miss any post, stay tuned!
Ankit helps brands navigate their digital maturity journey by bringing together analytics, CRO, ML, and AI in a practical, business-friendly way. Having worked with global teams across industries, he focuses on simplifying complex MarTech concepts and turning them into measurable outcomes. On weekends, you’ll likely find him deep in a reflective read or sharing a coffee with a client while simplifying MarTech in the most human way possible.
Recommended Reading:

Why Traditional Ecommerce Is Becoming Interface-Led Commerce – Agentic Commerce Series | EP 2
24 June, 2026 Your storefront was built for a buyer who walks in. More of them are calling ahead and never showing up. The ecommerce interface, as brands have known it, the homepage, category pages, the PDP, the search bar, was designed around a specific human behaviour: arrive, browse, discover, decide, buy. Every pixel of it is optimised for that journey.
Subscribe with Us!
Never miss any post, stay tuned!
Trusted by leading brands


