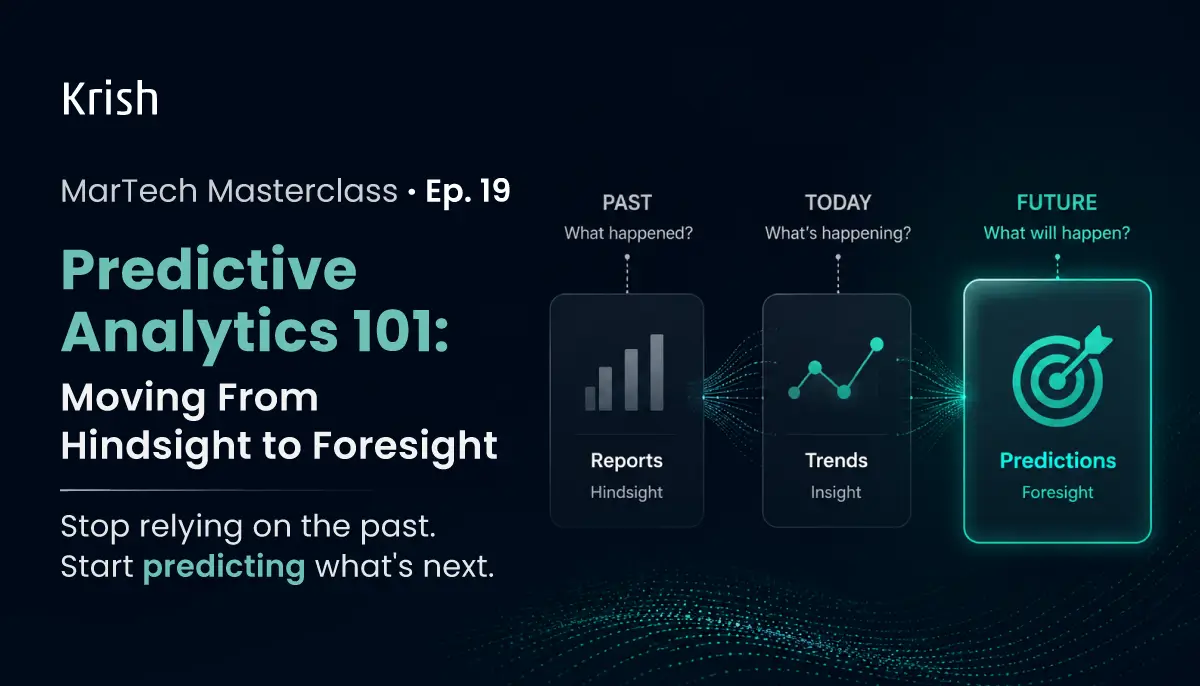
Your MarTech Stack Is Looking in the Wrong Direction
Most MarTech stacks are architecturally optimized for one thing: describing the past.
Revenue last quarter, churn in the last 90 days, campaign performance last week – the dashboards are polished and the data looks clean. Yet every output from that stack is a response to something that has already happened. The customer already churned. The demand spike already passed. The high-value cohort already drifted before anyone noticed.
This is the structural ceiling of a reporting-led analytics practice. It cannot surface a risk that has not yet materialized or flag an opportunity that has not yet resolved into an outcome. And by the time the dashboard confirms it, the window to act has already closed.
Predictive analytics is the architectural shift that breaks through that ceiling. It does not replace descriptive and diagnostic reporting as the foundation. What it adds is a forward-looking score derived from behavioral signals, trained on historical outcome patterns, and surfaced early enough to change what the business does next before the outcome is already locked in.
- According to a Gartner survey of 403 analytics and AI leaders, over 50% of organizations now use AI tools for automated insights within their analytics workflows. Yet the same research makes clear that most of this activity sits at the descriptive and early diagnostic layer.
The majority of organizations are using analytics to understand what happened faster, not to anticipate what is about to happen. That gap between speed of hindsight and presence of foresight is where competitive divergence in data-mature organizations is now concentrating.
In episode 13, we covered RFM (Recency, Frequency, Monetary) segmentation as a behavioral framework for describing customer state. Predictive analytics extends that framework from description into forecasting.
This episode maps the journey from hindsight to foresight:
- What each analytics stage actually does and what it cannot do.
- Why historical reporting, no matter how well built, cannot future-proof a business.
- Where predictive models produce the highest commercial leverage.
- What the data infrastructure needs to look like before a model is worth building.
- And how to start without committing to a six-month data science program.
The Four Stages of Analytics Maturity
Gartner’s analytics maturity model defines four stages, each answering a progressively more valuable question about the business. Understanding precisely what each stage does and does not do is what prevents teams from overinvesting in tools before the foundational layer is solid enough to support them.
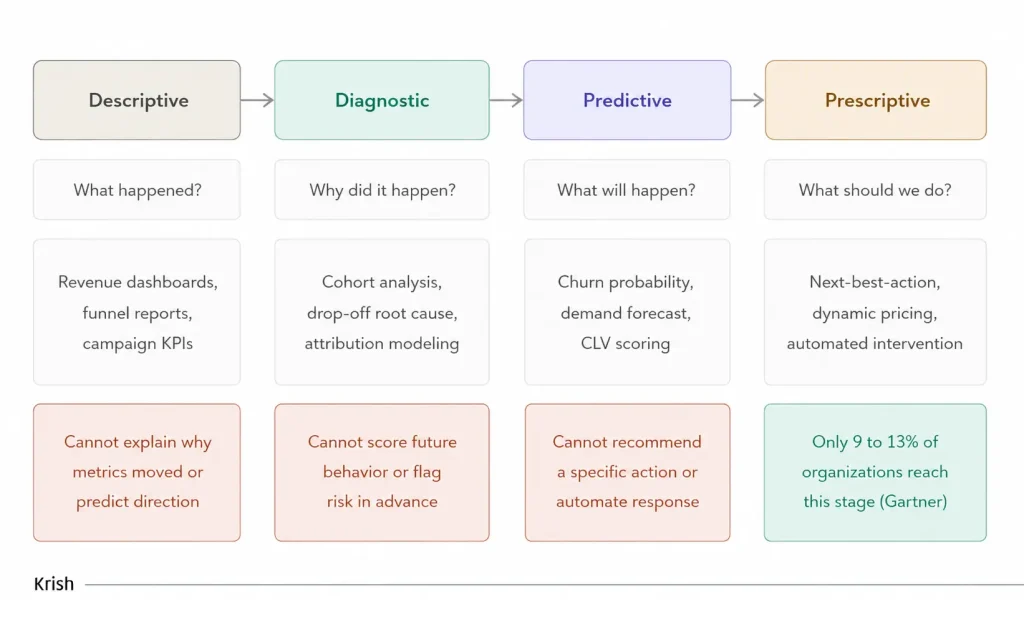
1. Descriptive analytics answers: what happened?
It is where most MarTech stacks live, and it is indispensable. Clean revenue reports, segmented funnel data, and channel attribution are all descriptive outputs. The limitation is direction, not quality. A descriptive dashboard showing last month’s churn rate confirms a state that has already resolved. It cannot surface a risk forming in the customer base right now.
2. Diagnostic analytics answers: why did it happen?
Cohort analysis, funnel investigation, and attribution modeling sit here. A diagnostic analysis of last quarter’s churn might identify that customers who skipped an onboarding step within their first two weeks churned at three times the rate of those who completed it. That insight is genuinely valuable. Its structural limitation is that it arrives at least one cohort cycle after the behavioral pattern generated it. The customers currently in week two without completing onboarding are invisible to diagnostic analysis until the pattern resolves again.
3. Predictive analytics answers: what will happen?
It takes the pattern that diagnostic analysis identified and trains a model to recognize its early-stage behavioral signature in active customers before it resolves into an outcome. The model assigns a probability score per customer, updated continuously as behavioral signals change. A customer who skipped onboarding and has logged in only once in week two receives a high churn probability score now, weeks before any explicit disengagement signal appears.
4. Prescriptive analytics answers: what should we do about it?
It converts a predictive score into a specific recommended action, delivered automatically through the campaign and orchestration infrastructure. According to Gartner research, only 9 to 13% of organizations reach this level of maturity. It requires reliable predictive models as inputs, domain expertise to define business rules and constraints, and operational integration to act on the recommendations produced.
One critical nuance: these stages are not strictly sequential in deployment. Most mature organizations run multiple stages simultaneously across different functions. What cannot be bypassed is the data foundation. A predictive model built on misconfigured descriptive data inherits every upstream error and amplifies it, because the model trains on signals that do not accurately reflect the behavior it is trying to predict. This is the same principle covered in episode 2 of this series: GA4 configuration errors do not only damage dashboards. They corrupt every downstream system built on that data, predictive models included.
Why Historical Reporting Cannot Future-Proof a Business
The commercial case for predictive analytics is not about technology preference. It is about the intervention window, and how that window relates to the cost and effectiveness of acting within it.
Consider what happens with churn in a business operating purely on historical reporting:
- The customer churns and the descriptive report confirms it on Monday. The intervention window closed at the point of cancellation. A retention offer extended at that moment competes against a decision already made.
- Diagnostic analysis of last quarter’s cohort identifies the behavioral pattern that preceded those cancellations. The insight is correct and actionable for future product and onboarding design. The customers currently exhibiting those same patterns in real time are still invisible.
- A churn prediction model scores every active customer on a rolling basis using those same behavioral signals. A customer whose pattern matches historical churners receives a high-risk score three weeks before any visible disengagement. The retention team acts while the customer is still engaged and the relationship is still intact.
The intervention that fires against a predictive score costs a fraction of the acquisition spend required to replace a churned customer. It also competes against a decision the customer has not yet made, which is structurally more winnable than one they have. This is the commercial logic behind predictive investment, and it holds consistently across demand forecasting, CLV modeling, and lead scoring use cases.
The business analytics software market was estimated at $394.55 billion in 2024 and is projected to reach $1648.59 billion by 2035, exhibiting a compound annual growth rate (CAGR) of 13.88% during the forecast period 2025 – 2035. That growth rate reflects where commercial returns are concentrating, in the stages that act before outcomes are determined rather than after.
Three Use Cases That Deliver Commercial Impact
1. Demand Forecasting
Demand forecasting uses historical transaction data, seasonal patterns, promotional calendars, and external signals such as economic indicators to produce a probabilistic estimate of future demand at the product, category, or SKU (Stock Keeping Unit) level across a defined horizon.
The model learns the relationship between input variables and historical demand outcomes, then applies that relationship to current variable values to generate a forward-looking volume estimate with a confidence interval. The output drives procurement, inventory positioning, and supply chain planning directly.
A business ordering reactively based on last month’s actuals will consistently under-order heading into demand spikes and over-order coming out of them. A calibrated forecast positions inventory ahead of the signal rather than behind it, reducing both stockout-driven revenue loss and overstocking-driven carrying costs simultaneously. As Krish’s supply chain management guide covers, AI-powered demand planning tools can analyze historical data alongside market trends and external factors in ways that manual ordering logic cannot replicate at scale.
Demand forecasting is typically the most accessible first predictive use case for three reasons:
- The required input data, historical transaction records, already exists in structured form in most ecommerce backends
- The target variable is unambiguous: units sold or revenue per defined period
- Forecast accuracy is directly measurable against actuals within each cycle, providing a fast feedback loop for model refinement
2. Churn Prediction
A churn prediction model is a supervised classification model trained on labeled historical behavioral data. The training dataset contains records of customers who churned and customers who did not, along with the behavioral signals observed in the weeks and months preceding each outcome. The model learns which combinations of signals, weighted by recency and intensity, are most predictive of churn, and produces a probability score per active customer updated continuously as their signals change.
The behavioral signals that most reliably precede churn vary by product and business model, but common patterns across ecommerce and subscription businesses include:
- Declining session frequency over successive weeks
- Narrowing feature or product category engagement to a single area
- Increasing time between purchases in repeat-buy categories
- Support ticket escalations within ninety days of a renewal or reorder window
- Communication opt-outs from transactional as well as promotional messages
None of these signals is individually deterministic. The model learns the multivariate combination that historically preceded churn at a statistically significant rate, and identifies which current customers’ behavioral trajectories most closely resemble those patterns. As Krish’s marketing automation guide notes, this is what allows teams to prioritize high-risk accounts rather than treating all customers equally, with the model output becoming the segmentation logic that determines who enters a retention intervention sequence and at what urgency level.
3. Customer Lifetime Value (CLV) Modeling
Predictive CLV is not a historical average order value calculation. It is a forward-looking revenue estimate per customer, generated from early behavioral signals and trained on the historical relationship between those signals and long-term revenue outcomes in prior cohorts.
The model takes inputs such as first-purchase category, initial purchase value, days to second purchase, breadth of early product catalog engagement, and acquisition channel, and produces an estimated revenue contribution over a defined horizon, typically twelve or twenty-four months, for each customer individually.
When acquisition channels are evaluated by the predicted CLV of the customers they produce rather than by immediate conversion rate, budget allocation decisions change substantially:
- A channel converting at a lower rate but consistently producing high-CLV, low-churn customers has a higher expected commercial return than one converting frequently but producing single-purchase customers
- That distinction is invisible without CLV modeling, because historical AOV (Average Order Value) averages across all customers from all channels obscure the cohort-level variation
- GA4 formalizes this direction through its predictive audiences feature, where purchase probability and churn probability scores are surfaced as native predictive metrics built on behavioral event data, enabling proactive audience activation without requiring custom model development
CLV modeling also feeds the segmentation layer directly. RFM scoring from episode 13 identifies what a customer has done historically. Predictive CLV adds the forward-looking dimension: which customers in the current population are on a trajectory that historically produced high long-term value, regardless of where their RFM scores currently sit.
What Data Predictive Models Actually Need
The most consistent reason predictive analytics projects fail is not model selection or algorithm complexity. It is data quality discovered mid-project. A model inherits every error in its training data and amplifies it, because the model is trained to find patterns, and corrupted data teaches it the wrong ones.
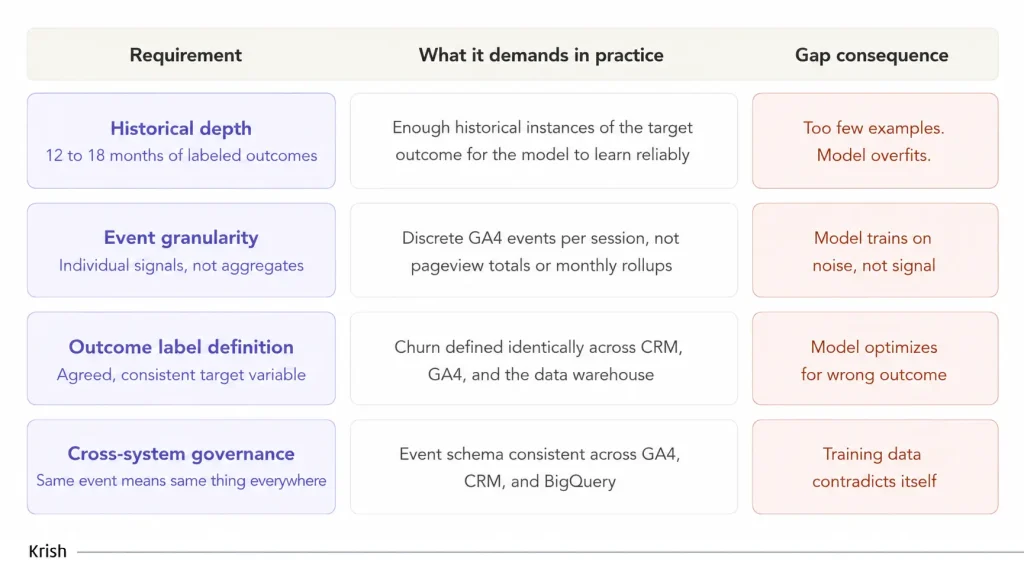
- Historical depth refers to the volume of labeled historical outcomes the model can learn from. A churn prediction model needs enough historical instances of both churn and retention, with the behavioral signals preceding each outcome intact, to identify statistically reliable patterns. Eighteen months of consistent, labeled data is a reasonable baseline for most supervised models in ecommerce and subscription businesses. Consistent is the critical qualifier: if GA4 event tracking was reconfigured partway through that window, the event schema before and after the change may not be comparable. A model cannot learn reliably from data that encodes two different definitions of the same behavioral event across different time periods.
- Event granularity separates analytics data from model training data at the architectural level. Aggregate metrics describe populations. A supervised model needs individual-level behavioral sequences: which specific actions this specific user took, in which order, across which sessions, over which time window. This requires discrete GA4 event tracking where individual interactions are registered as named events with associated parameters. The funnel tracking configuration that enables accurate funnel analysis at the descriptive level is also what produces the behavioral event stream a model needs at the individual level.
- Outcome label definition is the requirement teams most consistently underestimate. A supervised model needs a binary or categorical label attached to each historical customer record: churned or not churned, converted or not converted, high-CLV or low-CLV. Defining those labels requires precise organizational agreement. Is churn a subscription cancellation, sixty days of inactivity, an explicit opt-out, or a weighted combination of signals? If product teams, CRM teams, and finance teams use different definitions of the same outcome, the labeled training data reflects multiple competing definitions and the model cannot learn a consistent predictive signal.
- Cross-system governance requires that the same event means the same thing across every system contributing to training data. When GA4, the CRM, and the data warehouse each hold a slightly different version of the same customer behavioral record, because event naming drifted or schema changes were deployed without cross-system coordination, the model trains on data that contradicts itself. As Krish’s hidden data gaps analysis describes, this is measurement architecture operating in parallel realities. For dashboards, it produces reconciliation headaches. For model training data, it produces irreducible noise that no algorithm can resolve downstream.
Starting Small: Your First Predictive Analytics Project
The most common first mistake is selecting the most ambitious use case. Full churn prediction with real-time scoring across an entire customer base, integrated into a campaign trigger workflow, requires individual-level behavioral signals, labeled historical outcomes, a clean identity graph, cross-system data governance, and an activation pipeline connected to the orchestration layer. That is a mature program. It is not a starting point.
A first project should satisfy three specific conditions:
- The historical data required already exists in a reasonably clean state
- The model output replaces or informs a decision the team currently makes manually
- Accuracy is measurable against observed outcomes within a timeframe that sustains organizational confidence
Against those criteria, three starting points prove consistently viable:
Purchase propensity scoring through GA4 predictive audiences
GA4 natively generates purchase probability and churn probability as predictive metrics, trained using Google’s ML (Machine Learning) infrastructure on behavioral event data already flowing through the property. No custom development is required. The only prerequisite is a correctly configured GA4 ecommerce implementation where purchase, add-to-cart, and session events fire as discrete labeled events. The predictive audience output can be activated directly in Google Ads for bid adjustment, exported to a CDP (Customer Data Platform) for campaign targeting, or used to segment the email list. Accuracy can be validated by comparing the high-propensity cohort’s actual conversion rate against the baseline within two to four weeks of deployment.
Demand forecasting on a single high-velocity product category
Rather than forecasting across the full SKU catalog, identify one category with sufficient historical transaction volume and a clear seasonal signal, and build or configure a time-series forecast for that category alone over a two to four week horizon. Measure forecast accuracy against actuals each cycle before expanding scope. The constrained starting point surfaces data quality issues in a controlled context, builds organizational confidence in model-driven inputs, and produces a measurable result faster than a full-catalog approach would allow.
Next-purchase-interval prediction for a repeat-buy segment
For businesses with a meaningful cohort of repeat purchasers, modeling the expected number of days to the next purchase per customer is a tractable first supervised regression problem. The training data is purchase history, which most ecommerce businesses hold in structured form in their backend systems. The model produces a predicted repurchase date per customer. When a customer passes their predicted repurchase window without converting, a triggered re-engagement sequence fires. The measurement is clean: incremental conversion rate in the triggered group versus a holdout group that received no trigger.
This structure connects directly to the holdout measurement discipline from episode 18, where the same experimental design validates the incremental impact of a model-driven trigger.
In every case, the first project is not the destination. It builds the data pipelines, the labeling discipline, the measurement cadence, and the cross-functional alignment that the next, more ambitious project inherits rather than rebuilds from scratch.
Finally: The Stack That Sees Around Corners
Every episode in this series has added a capability to the same underlying architecture: clean event tracking so behavioral data is trustworthy, funnel analysis so friction is visible, segmentation so campaigns reach the right audience, orchestration so the right message arrives at the right moment, experimentation so improvements are validated, attribution so test results translate into business impact.
Predictive analytics is what that architecture was always pointing toward. It allows the stack to act before the signal has fully resolved into an outcome.
- The segmentation model in episode 13 described customers by what they have done. Predictive CLV scoring adds the forward-looking dimension.
- The orchestration logic in episode 14 determined which channel carries which message at which moment. Churn probability scores give that logic an earlier and more precise trigger.
- The experimentation program in episodes 15 through 18 refined conversion at the point of contact. Demand forecasting models give the business upstream visibility into how many customers to expect at that contact point and when.
Every predictive capability runs on the same prerequisite: data that is clean, granular, consistently governed, and correctly structured at the collection layer.
Organizations that have invested in GA4 configuration quality, discrete behavioral event tracking, and cross-system schema governance are building the foundation that predictive models run on. Those that have not will find their model outputs unreliable, not because the algorithms are wrong, but because the training data encoded errors that no model corrects for downstream.
Predictive analytics is not a technology layer added on top of a mature MarTech stack. It is what a mature MarTech stack was always building toward: a connected operating model where every layer of data collection, segmentation, orchestration, and measurement compounds into the capacity to see what is about to happen and act on it before it does.
Table of Content
- Your MarTech Stack Is Looking in the Wrong Direction
- The Four Stages of Analytics Maturity
- Why Historical Reporting Cannot Future-Proof a Business
- Three Use Cases That Deliver Commercial Impact
- What Data Predictive Models Actually Need
- Starting Small: Your First Predictive Analytics Project
- Finally: The Stack That Sees Around Corners
Subscribe with Us!
Never miss any post, stay tuned!

Ankit helps brands navigate their digital maturity journey by bringing together analytics, CRO, ML, and AI in a practical, business-friendly way. Having worked with global teams across industries, he focuses on simplifying complex MarTech concepts and turning them into measurable outcomes. On weekends, you’ll likely find him deep in a reflective read or sharing a coffee with a client while simplifying MarTech in the most human way possible.
Recommended Reading:
The 7 UX Mistakes That Quietly Reduce Conversion Rates – Conversion Maturity Series | EP 07
8 July, 2026 Good UX is not the absence of bad design. It is the presence of decisions made from the visitor's side of the screen, not the team's. Most ecommerce sites are built from the inside out: the information architecture reflects how the business thinks about its products. The navigation reflects how the catalog is organized internally, the checkout reflects what the CRM team needed to capture, and the CTA placement reflects where the design grid had room. Each decision had a rationale. None of them were made by someone actually trying to buy.
Subscribe with Us!
Never miss any post, stay tuned!
Trusted by leading brands


